Highlights
- •
It is difficult to distinguish fp-AML and hm-ccRCC using conventional imaging methods.
- •
Whole-tumor histogram analysis can serve as a powerful mean to distinguish fp-AML and hm-ccRCC.
- •
A comprehensive model with clinic, imaging and histogram has the best diagnostic performance.
- •
The comprehensive model provide a noninvasive method for developing personalized treatment plan.
Abstract
Purpose
To determine the diagnostic value of a comprehensive model based on unenhanced computed tomography (CT) images for distinguishing fat-poor angiomyolipoma (fp-AML) from homogeneous clear cell renal cell carcinoma (hm-ccRCC).
Methods
We retrospectively reviewed 27 patients with fp-AML and 63 with hm-ccRCC. Demographic data and conventional CT features of the lesions were recorded (including sex, age, symptoms, lesion location, shape, boundary, unenhanced CT attenuation and so on). Whole tumor regions of interest were drawn on all slices to obtain histogram parameters (including minimum, maximum, mean, percentile, standard deviation, variance, coefficient of variation, skewness, kurtosis, and entropy) by two radiologists. Chi-square test, Mann–Whitney U test, or independent samples t-test were used to compare demographic data, CT features, and histogram parameters. Multivariate logistic regression analyses were used to screen for independent predictors distinguishing fp-AML from hm-ccRCC. Receiver operating characteristic curves were constructed to evaluate the diagnostic performances of the models.
Results
Age, sex, tumor boundary, unenhanced CT attenuation, maximum tumor diameter, and tumor volume significantly differed between patients with fp-AML and those with hm-ccRCC ( P < 0.05). The minimum, mean, first percentile (Perc.01), Perc.05, Perc.10, Perc.25, Perc.50, Perc.75, Perc.90, Perc.95, and Perc.99 of the Fp-AML group were higher than those of the hm-ccRCC group ( P < 0.05). Coefficient of variance, skewness, and kurtosis were lower than those in the hm-ccRCC group (all P < 0.05). Age, maximum tumor diameter, unenhanced CT attenuation, and Perc.25 were independent predictors for distinguishing fp-AML from hm-ccRCC (all P < 0.05). The comprehensive model, incorporating age, maximum tumor diameter, unenhanced CT attenuation, and Perc.25, showed the best diagnostic performance (AUC = 0.979).
Conclusion
The comprehensive model based on unenhanced CT imaging can accurately distinguish fp-AML from hm-ccRCC and may assist clinicians in tailoring precise therapy, while also helping to improve the diagnosis and management of renal tumors, leading to the selection of effective treatment options.
1
Introduction
Angiomyolipomas (AMLs) are common benign neoplasms of the kidney, with a prevalence of 0.3% to 3.0%. It consists of thick-walled blood vessels, adipose tissue, and smooth muscle in proportions that vary significantly among individual tumors [ ]. Fat-poor angiomyolipoma (fp-AML), which accounts for approximately 5% of AMLs, is defined as an angiomyolipoma containing little to no fat and is most commonly encountered in the fourth to sixth decades of life, with a female preponderance [ ]. Clear cell renal cell carcinoma (ccRCC) is the most common type, accounting for approximately 75% of renal cell carcinoma (RCC) [ , ]. Homogeneous ccRCC (hm-ccRCC) is defined as ccRCC without obvious necrosis, cysts, or hemorrhage [ ]. An accurate differential diagnosis between these two groups plays a vital role in assisting clinicians in tailoring precise therapy.
However, fp-AML diagnosis is challenging, and various imaging findings on both CT and MR have been described with variable diagnostic utility. These imaging features included the density on unenhanced CT images, CT histogram analysis, CT/MRI enhancement patterns, chemical-shift magnetic resonance imaging (MRI) parameters, T2 signal intensity ratios, and contrast-enhanced ultrasonography parameters [ ]. Although previous studies have achieved good results, their findings have not been validated. Many studies have attempted to distinguish fp-AML from RCC [ , ]. Computed tomography (CT) and MRI is a crucial tool for guiding preoperative differential diagnosis and postoperative follow-up in patients with renal neoplasm. Based on typical signs, the differential diagnosis of RCC and fp-AML is relatively easy. However, a previous study showed that AMLs share many overlapping conventional imaging characteristics with hm-ccRCCs, while conventional imaging findings also depend on the experience of the radiologist, which is highly subjective and difficult to quantify, making the differential diagnosis relatively challenging. Therefore, in a previous study, both groups were distinguished using a CT-based radiomic nomogram [ ]. However, this study had some limitations, namely, the small sample size (N = 99) and the lack of external validation.
Whole-tumor histogram analysis is an objective and reproducible image analysis method. It can effectively extract microscopic information that is difficult to identify with the naked eye. Using this method, multiple quantitative parameters extracted from tumors can provide a comprehensive assessment of the whole tumor characteristics [ , ]. This method has become important in the field of renal neoplasm assessment. Many studies have reported the application of this method for renal tumors [ , ]. Thus, we hypothesized that whole-tumor histogram analysis could distinguish fp-AML from hm-ccRCC.
This study aims to effectively improve the diagnosis and management of renal tumor patients by establishing a predictive model, providing a more accurate basis for clinicians in selecting treatment options. At the same time, by utilizing histogram parameters based on unenhanced CT, the goal is to facilitate the model’s adoption in various medical institutions of different sizes in the future and avoid unnecessary damage from contrast agents and radiation for patients.
2
Materials and methods
2.1
Patients
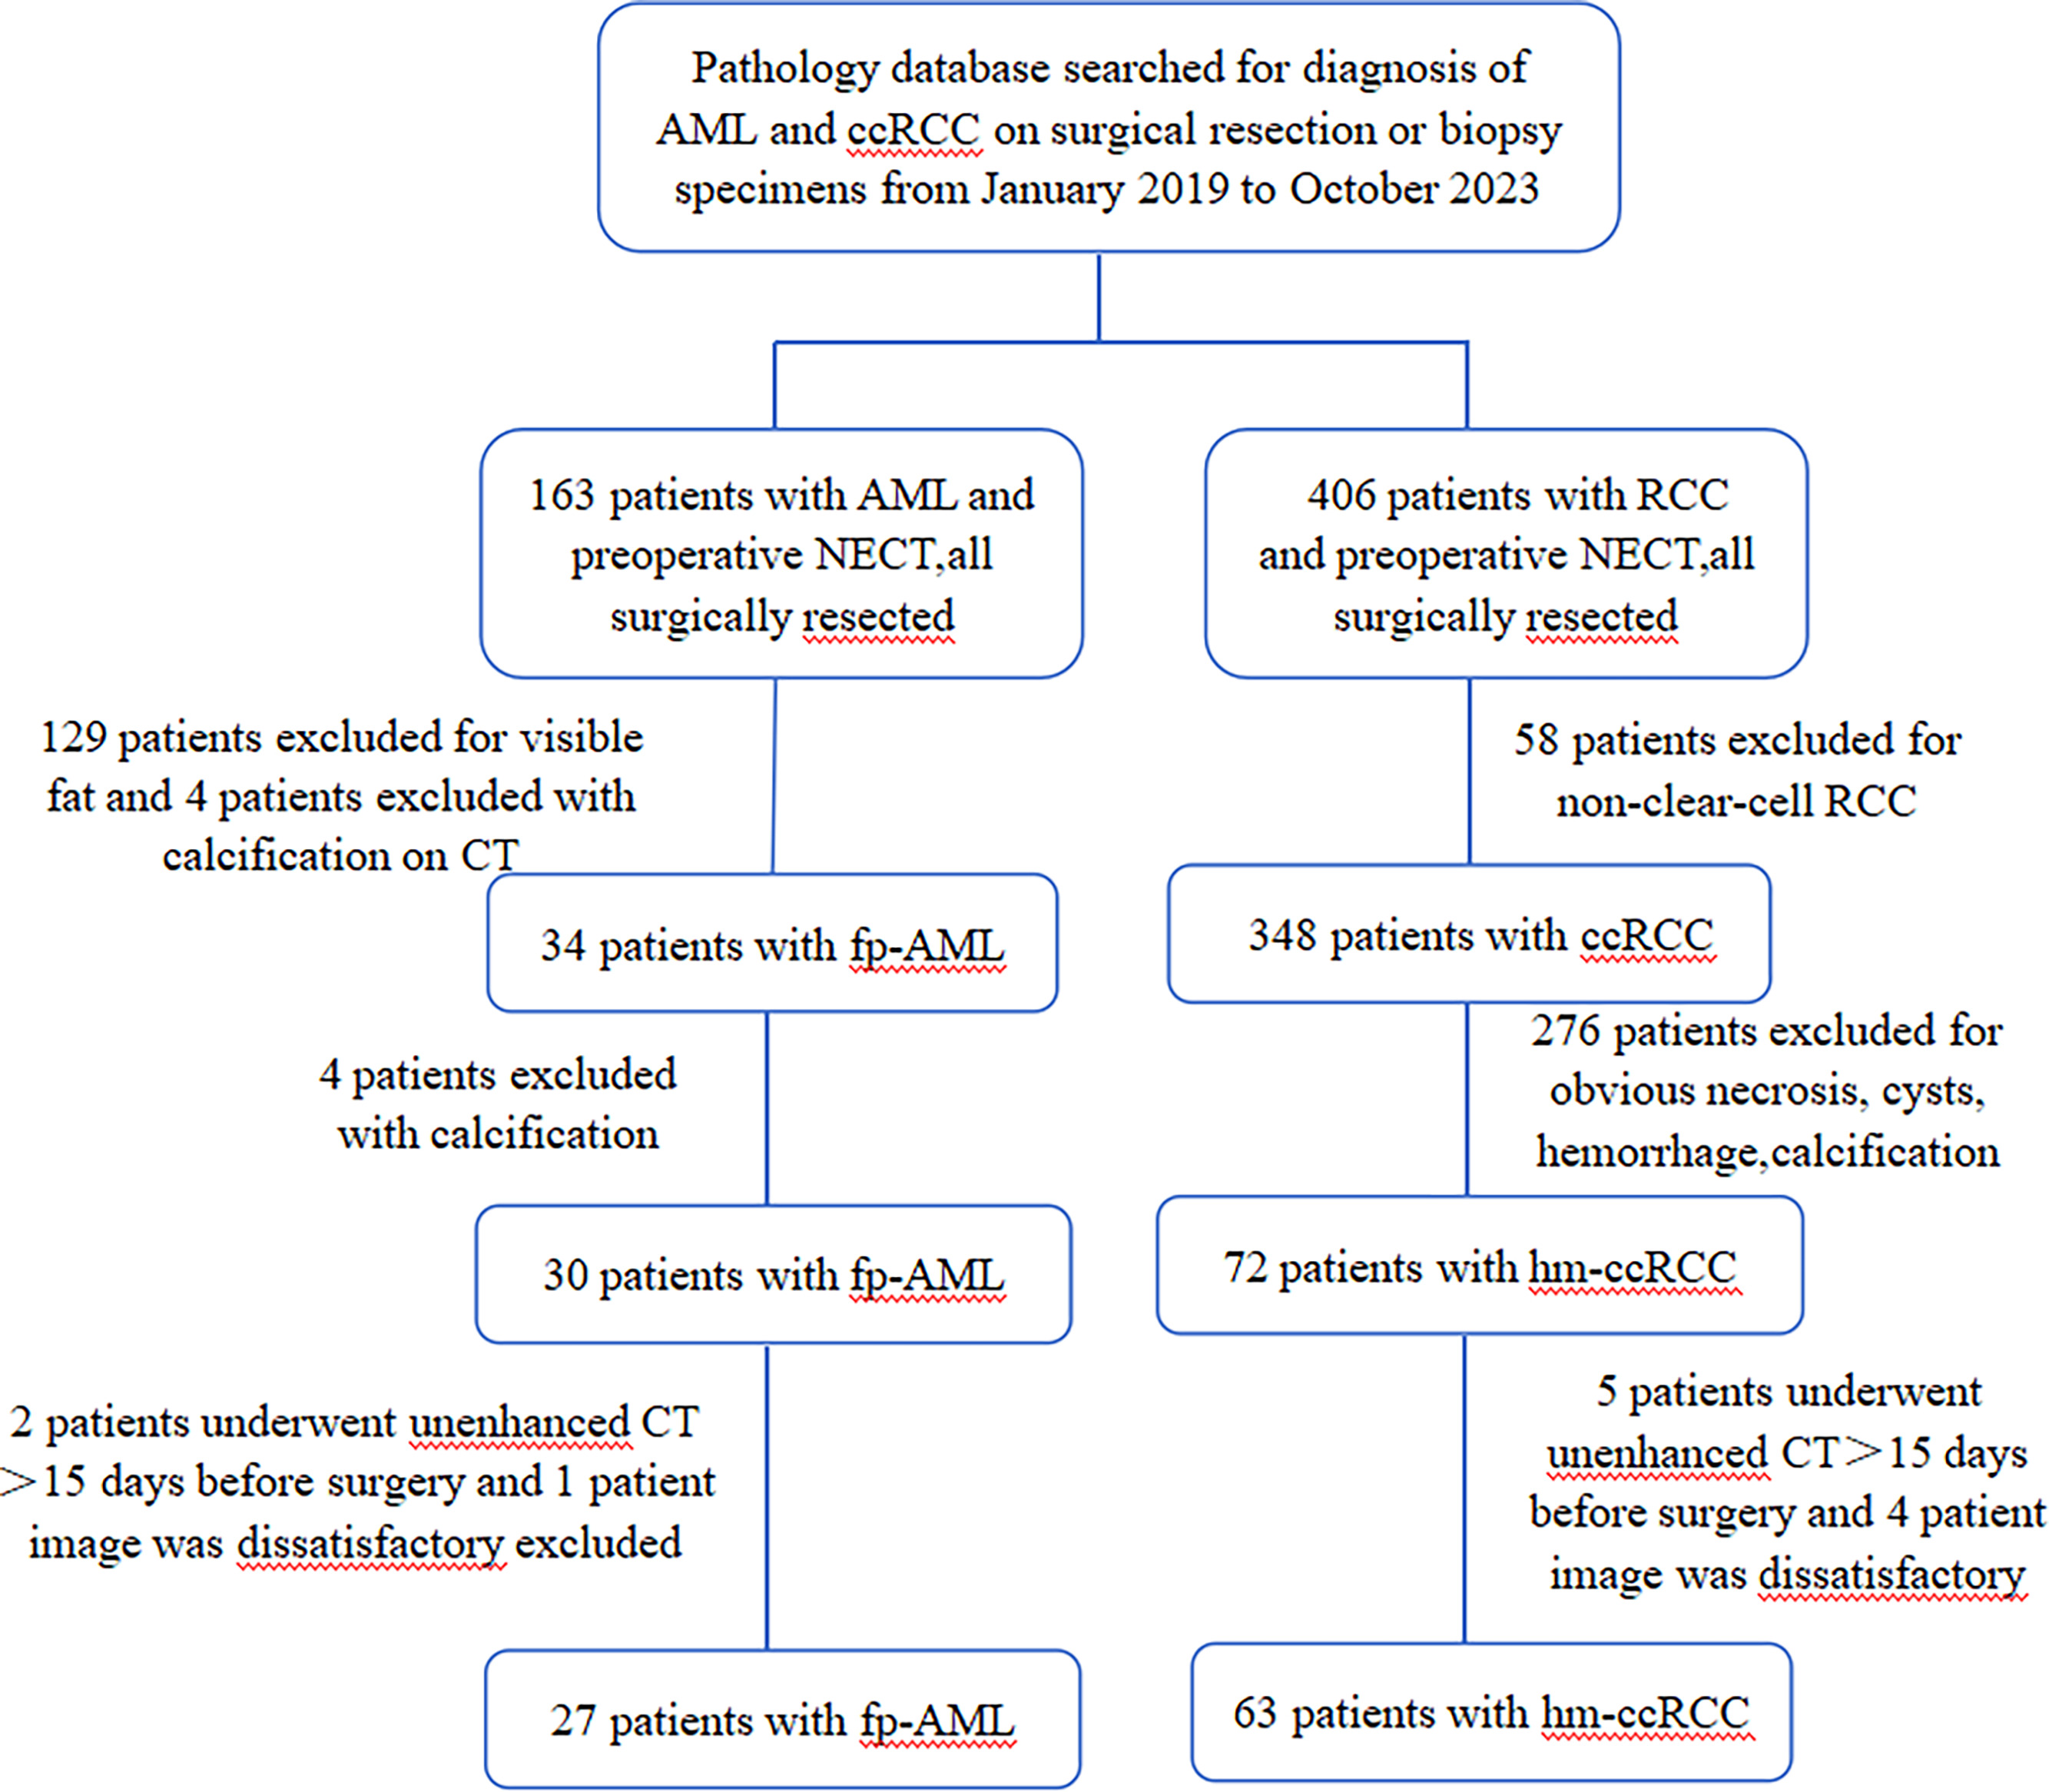
This retrospective study was approved by the local Institutional Review Board. The requirement for informed consent was waived due to this study’s retrospective nature and approval number: 2022A-271. Ninety patients with fp-AML ( n = 27) and hm-ccRCC ( n = 63) between 2019 and 2023 were recruited from the picture archiving and communication system at our hospital according to the following inclusion criteria: (1) patients who had a definitive pathologic diagnosis of either AML or ccRCC, (2) patients who underwent unenhanced CT < 15 days before surgery and whose image quality was satisfactory for analysis, and (3) patients with complete clinicopathological data. The exclusion criteria were as follows: (1) patients with AML with macroscopic intralesional fat on unenhanced CT images; (2) patients with ccRCC with obvious necrosis, cysts, or hemorrhage; (3) patients with AML or ccRCC with calcification; and (4) patients who received chemotherapy or radiotherapy before surgery. Study workflow with respect to patient selection is shown in Fig. 1 .
2.2
CT acquisition
Unenhanced CT scans of all patients were performed using Discovery CT 750 HD (GE Healthcare, Waukesha, WI), Revolution 256-row CT (GE Healthcare, Waukesha, WI), ICT 256 (Brilliance iCT256, Philips Healthcare), and Dual-source Force CT (Somatom Force, Siemens Healthcare, Forchheim, Germany). The patients were placed in the supine position and scanned from the superior edge of the liver to the anterior superior iliac spine. The scanning parameters were as follows: tube voltage, 120 kVp; tube current, automatically modulated; collimation width, 0.625 mm; tube speed, 0.7 s/r. The pitch ratio was 0.992:1. CT images were reconstructed at 1.25 mm slice thickness and 1.25 mm interval.
2.3
Image analysis
Two independent abdominal radiologists (with 6 and 10 years of experience, respectively) reviewed all the images and were blinded to the pathological results. Conventional CT features, including location (right or left kidney), tumor shape (round or irregular), boundary (clear or unclear), maximum tumor diameter, tumor volume, and unenhanced CT attenuation, were assessed and recorded. Histogram analysis was performed using open-source FireVoxel software. The specific steps were as follows: First, unenhanced CT images of each patient were imported into the FireVoxel software. Second, the volume of interest (VOI) along the contour of the tumor was sketched to extract the histogram parameters by the two abdominal radiologists mentioned above [ , ]. The sketched regions of interest should include the whole tumor components to assess tumor heterogeneity better [ ]. Finally, histogram parameters, including minimum, maximum, mean, Perc.01, Perc.05, Perc.10, Perc.25, Perc.50, Perc.75, Perc.90, Perc.95, Perc.99, standard deviation (SD), variance, coefficient of variation (CV), skewness, kurtosis, and entropy of the unenhanced CT images were extracted and recorded (Perc. value is the percentile of the pixel values within the outlined region of interest of the tumor).
2.4
Histological analysis
Pathological analysis of fp-AML and hm-ccRCC based on tissue sections was performed by an abdominal pathologist (with 12 years of clinical experience).
2.5
Statistical analysis
All data were analyzed using SPSS (version 25.0; SPSS Inc., Chicago, IL) and MedCalc 20.2 (MedCalc, Mariakerke, Belgium). The Inter-observer reproducibility of the histogram parameters and continuous CT variables was evaluated using the intraclass correlation coefficient (ICC). The Inter-observer reproducibility of categorical CT features was evaluated using kappa values. The chi-square test, Mann–Whitney U test, or independent samples t-test were used to compare demographic data, CT features, and histogram parameters between fp-AML and hm-ccRCC. Data that conform to a normal distribution are expressed as mean ± standard deviation, and differences between groups are compared using independent samples t-test; non-normally distributed data are expressed as median (lower and upper quartiles), and differences between groups are compared using Mann–Whitney U test. Categorical variables are expressed as percentages, and differences between groups are tested using chi-square test. Multivariate logistic regression analyses using the forward method were employed to screen for independent predictive factors for distinguishing fp-AML from hm-ccRCC. Receiver operating characteristic (ROC) curves were constructed to evaluate the diagnostic performances of the different models. P < 0.05 was considered statistically significant.
3
Results
3.1
Patients
Ninety patients with fp-AML ( n = 27) and hm-ccRCC ( n = 63) were included in the study. The fp-AML group included eight men and 19 women, with a mean age of (47.74 ± 15.106) years. The hm-ccRCC group included 36 men and 27 women, with a mean age of (58.37 ± 8.315) years. There were significant differences between the two groups in terms of sex and age (all P < 0.05). However, no significant difference between the two groups in terms of clinical symptoms was observed ( P = 0.441). Patient demographic characteristics and clinical symptoms are summarized in Table 1 .
| Parameters | fp-AML ( n = 27) | hm-CCRCC ( n = 63) | Statistical value | P -value |
|---|---|---|---|---|
| Age(Y) | 47.74 ± 15.106 | 58.37 ± 8.315 | 12.989 | 0.001 |
| Sex | 0.017 | |||
| Male | 8 (29.6%) | 36 (57.1%) | 5.726 | |
| Female | 19 (70.4%) | 27 (42.9%) | ||
| Symptom | 0.441 | |||
| Yes | 6 (22.2%) | 19 (30.2%) | 0.593 | |
| No | 21 (77.8%) | 44 (69.8%) | ||
| Location | 0.355 | |||
| Right kidney | 13 (48.1%) | 37 (58.7%) | 0.857 | |
| Left kidney | 14 (51.9%) | 26 (41.3%) | ||
| Tumor shape | 0.319 | |||
| Round | 23 (85.2%) | 58 (92.1%) | 0.994 | |
| Irregular | 4 (14.8%) | 5 (7.9%) | ||
| Boundary | < 0.001 | |||
| Clear | 24 (88.9%) | 27 (42.9%) | 16.309 | |
| Unclear | 3 (11.1%) | 36 (57.1%) | ||
| Maximum tumor diameter | 2.50 (2.00–3.80) | 4.10 (3.10–5.50) | -4.541 | < 0.001 |
| Tumor volume (cm 3 ) | 4.90 (2.25–14.18) | 19.62 (9.50–45.06) | -4.6 | < 0.001 |
| Unenhanced CT attenuation | 53.89 ± 8.030 | 35.46 ± 9.356 | 8.917 | < 0.001 |
3.2
Inter-observer reproducibility
The ICC for all histogram parameters and continuous CT variables extracted by the two radiologists was 0.854 to 0.993, reflecting excellent inter-observer reproducibility.
3.3
Comparison of conventional CT features between fp-AML and hm-ccRCC
There were significant differences between the two groups in terms of tumor boundary, maximum tumor diameter, tumor volume, and unenhanced CT attenuation (all P < 0.05). However, no significant differences were observed between the two groups regarding tumor location ( P = 0.355) or shape ( P = 0.319). Detailed conventional CT features of fp-AML and hm-ccRCC are presented in Table 1 .
3.4
Comparison of histogram parameters between fp-AML and hm-ccRCC
The mean, minimum, Perc.01, Perc.05, Perc.10, Perc.25, Perc.50, Perc.75, Perc.90, Perc.95, and Perc.99 were significantly higher in the fp-AML group than in the hm-ccRCC group (all P < 0.05). CV, skewness, and kurtosis were significantly lower in the fp-AML group than in the hm-ccRCC group (all P < 0.05). However, no significant differences were observed between the two groups in terms of maximum ( P = 0.258), SD ( P = 0.131), variance ( P = 0.156), or entropy ( P = 0.725). The detailed histogram parameters of the unenhanced CT images are listed in Table 2 . Representative fp-AML and hm-ccRCC cases are shown in Fig. 2 and Fig. 3 , respectively.
Related posts:
 Is primary retroperitoneal lymph node dissection the way forward for patients with testicular seminoma and limited retroperitoneal metastases?
 Critical care therapy and in-hospital mortality after radical nephroureterectomy for nonmetastatic upper urinary tract carcinoma
 The clinical relevance of cut-off percentage for high-grade urothelial carcinoma within low-grade urothelial carcinoma: A determining factor?
 Cumulative smoking exposure impacts oncologic outcomes of upper tract urothelial carcinoma
 The fragility index of randomized controlled trials in advanced/metastatic renal cell cancer
 Pathologic prostate cancer grade concordance among high-resolution micro-ultrasound, systematic transrectal ultrasound and MRI fusion biopsy
Stay updated, free articles. Join our Telegram channel

Full access? Get Clinical Tree


