Abstract
Aims
The aim of the study was to analyze the cut-off value for the percentage of the high-grade (HG) component that has clinical significance in urothelial carcinoma (UC).
Material and Methods
The study included a total of 362 patients, mixed-grade UC (MGUC) patients were classified as Combine Group (CG) 1 based on the presence of less than 5% HG areas. High-grade papillary UC (HGPUC) patients were grouped based on HG component proportions: CG2 (≥5%–<50% HG), CG3 (≥50%–<100% HG), and pure HGPUC (PHGPUC) for 100% HG components.
Results
There was a statistically significant difference between low-grade papillary UC (LGPUC) and CG1, CG2, or CG3, as well as LGPUC and PHGPUC, in terms of cancer-specific survival (CSS) ( hazard ratio (HR) = 19.85, 95% confidence interval (CI) = 2.30–171.10 P = 0.007, HR = 28.38, 95% CI = 3.50–229.97 P = 0.002, HR = 18.64, 95% CI = 2.26–153.64 P = 0.007, and HR = 35.41, 95% CI = 4.61–271.72 P < 0.001, respectively ). There was no statistically significant difference between PHGPUC and CG1, CG2, or CG3 in terms of CSS.
Conclusions
These findings suggest that even the presence of less than 5% HGPUC within LGPUC significantly impacts CSS. Furthermore, the increase in the percentage of HGPUC beyond 5% does not substantially influence the CSS. Based on these findings, disclosing the percentage of the high-grade component may be crucial for future patient management and treatment.
1
Introduction
Urinary bladder cancer is the seventh most common cancer worldwide, with urothelial carcinoma (UC) being the most common type [ , ]. The histological grade of bladder carcinoma plays a crucial role in predicting its biological characteristics, thereby influencing patient treatment and care. Urothelial neoplasms were initially incorporated into the World Health Organization (WHO) Classification System of Urinary System Tumors in 1973 and have undergone subsequent updates in the WHO classification systems of 2004, 2016, and 2022 [ ]. The WHO/International Society of Urological Pathology (ISUP) (2022 WHO/ISUP) grading system for UC focuses on the highest grade observed, despite the presence of multiple histological grades within the tumor [ ]. The impact of this heterogeneity on grading and its correlation with patient outcomes remains uncertain. To date, there is limited data regarding the significance of grade variation in individuals diagnosed with UC [ ]. In the current grading system, there is no consensus on the threshold of high-grade (HG) components required to classify a tumor as HGPUC. In the latest WHO 2022 classification, the commonly accepted but arbitrary cut-off involves grading a lesion based on its HG component. It is suggested to report it descriptively as ‘low-grade with <5% high-grade component’ if its HG component comprises less than 5% HG [ ]. As HGPUC if patients had the presence of equal or greater than 5% HG components. In the literature, when UC was classified into low-grade papillary UC (LGPUC), mixed-grade UC (MGUC), and HGPUC, different cut-off values were analyzed for the definition of MGUC, leading to varying results across different studies [ ] ( Table 1 ). Given the limited number of studies in the literature that demonstrated survival outcomes through cut-off analysis, the objective of our study was to specify and quantify the percentage of high-grade components that have a clinical impact.
| Studies | No. of patients | Follow-up time | Cut-off of high-grade percentage | Follow-up data |
|---|---|---|---|---|
| 1)Schubert et al. (2014) (18) | NMI MG: 17 (11%) NMI HG: 136 (89%) | 31.6 months (mean) | <50% high grade | AIFS (MG x HG): P = 0.03 (log-rank test) 2-year AIFS: MG: 88.2%, HG: 53.9% 5-year AIFS: MG: 88.2%, HG: 48.5% |
| 2)Chambers et al. (2021) (3) | NMI MG: 136 (100%) | 48.3 months (median) | ≤5% high grade | Recurrence: 71 (52.2%): 52 (38.2%) recurred as low or mixed grade, 18 (13.2%) recurred as high grade Stage progression: Ta →T1: 2 (1.8%), Ta, T1→T2: 0 (0%) 5-year RFS: 36% 5- year stage PFS: 100% 5-year grade PFS: 88% |
| 3)Cheng et al. (2000) (4) | [LG+HG (≥5%)] + [HG+LG (≥5%)]: (23 +16, resp.) [HG+ HG]: (14) | 92.4 months (mean) | 5%-95% high grade | PFS: ([LG + HG] + [HG + LG]) x [HG+ HG] P = 0.02 (Cox proportional hazards model) |
| 4)Culpan et al. (2021) (5) | NMI LG: 190 (51.5%) NMI MG: 40 (10.8%) NMI HG: 139 (37.7%) | 55.9 months (mean) | <25% high grade | RFS: LG: 46.3%, MG: 52.5%, HG: 50.4% (LG x MG x HG: P = 0.887) (log-rank test) PFS: LG: 95.3%, MG: 92.5%, HG: 87% (LG x MG x HG: P = 0.008) (log-rank test) CSS: LG: 97.9%, MG: 92.5%, HG: 92.1% (LG x MG x HG: P = 0.021) (log-rank test) |
| 5)Gofrit et al. (2014) (7) | NMI LG: 454 (70.7%) NMI MG: 32 (5%) NMI HG: 156 (24.3%) | 60 months (median) | ≤10% high grade | 5-year RFS: LG: 63.8%, MG: 66.4%, HG: 56.9% (LG x MG x HG: P = 0.252) (log-rank test) 5-year DSS: LG: 99.5%, MG: 100%, HG: 87.6% (LG x MG x HG: P < 0.0001 , LG x MG: p = 0.679) (log-rank test) |
| 6)Ho et al. (2021) (8) | NMI LG: 127 (58%) NMI MG: 27 (12%) NMI HG: 66 (30%) | 24 months (median) | MG: ≤5% high grade MG: >5% high grade | Recurrence: LG: 41.7%, MG (≤5% high grade): 78.6%, MG (>5% high grade): 61.5% HG: 47% RFS: LG: 58.3%, MG (≤5% high grade): 21.4%, MG (>5% high grade): 38.5% HG: 53% (LG x MG (≤5% high grade) x MG (>5% high grade) x HG: P = 0.16) (log-rank test) LG x MG (≤5% high grade) P = 0.37, LG x MG (>5% high grade) P = 0.7, LG x HG P = 0.34 (Multivariate Cox regression analysis) |
| 7)Reis et al. (2015) (17) | NI LG: 104 (47.3%) NI MG: 31 (14.1%) NI HG: 85 (38.6%) | LG: 40.1 months MG:39.7 months HG:33.1 months (mean) | ≤5% high grade | Recurrence: LG: 53.8%, MG: 45.2%, HG: 36.1% (LG x MG x HG: P = 0.54, LG x MG: P = 0.4, MG x HG: P = 0.87) (Pearson χ2) RFS: LG x MG x HG: P = 0.2 (log-rank test) Death of disease: LG: 0, MG: 0, HG: 16.5% (LG x MG x HG: P = 0.000, LG x MG: P = 1, MG x HG: P = 0.016 ) (Pearson χ2) OS: HG x MG: P = 0.0 3, MG x LG (No statistically significant difference, P was not given) (Multivariate Cox regression analysis) |
| 8)Kir et al. (2023) (10) | NMI LG:160 (35.3%) NMI MG:159 (35.1%) NMI HG:134 (29.6%) | LG: 48.4 months MG:43.4 months HG:44.4 months (mean) P = 0.299 | ≤5% high grade | RFS: LG: 65.6%, MG: 50.9%, HG: 42.5% (LG x MG x HG : P = < 0.001 ) (log-rank test) LG x MG: P = 0.056, MG x HG: P = 0.055 (Multivariate Cox regression analysis) DSS: LG: 98.1%, MG: 75.5%, HG: 54.5% (LG x MG x HG: P = < 0.001 ) (log-rank test) LG x MG: P = < 0.001 , MG x HG: P = 0.039 (Multivariate Cox regression analysis |
| 9)Kir et al. (2023) (current study) | NMI LG: 126 (34.8%) NMI CG: 102 (28.2%) NMI CG1: 33 (9.1%) NMI CG2: 35 (9.7%) NMI CG3: 34 (9.4%) NMI PHG: 134 (37.0%) | LG: 46.9 months CG1: 39.1 months CG2: 36.7 months CG3: 41.4 months PHG:40.8 months (mean) P = 0.124 | CG1: <5% CG2: 5%–49% CG3: 50%–99% | RFS: LG x CG1 x CG2 x CG3 x PHG: P = 0.014 LG x CG1: P = 0.096, LG x CG2: P = 0.290, LH x CG3: P = 0.511, LG x PHG: P <0.001 PHG x CG1: P = 0.475, PHG x CG2: P = 0.216, PHG x CG3: P = 0.097, PHG x LG: P <0.001 (Multivariate Cox regression analysis) CSS: LG x CG1 x CG2 x CG3 x PHG: P < 0.001 LG x CG1: P < 0.001 , LG x CG2: P < 0.001 , LH x CG3: P < 0.001 , LG x PHG: P < 0.001 PHG x CG1: P = 0.251, PHG x CG2: P = 0.596, PHG x CG3: P = 0.099, PHG x LG: P < 0.001 (Multivariate Cox regression analysis) RFS: LG x CG1: P = 0.03 , CG1 x CG2: P = 0.826, CG2 x CG3: P = 0.877, CG3 x PHG: P = 0.088 (log-rank test) CSS: LG x CG1: P < 0.001 , CG1 x CG2: P = 0.694, CG2 x CG3: P = 0.838, CG3 x PHG: P = 0.074 (log-rank test) |
2
Material and methods
2.1
Ethical approval
The study was approved by the ethics committee of Medeniyet University Goztepe Prof. Dr. Suleyman Yalcin City Hospital (UEAH) under the approval number 2022/0277.
2.2
Patients
UC is generally divided into nonmuscle-invasive bladder cancer (NMIBC), which constitutes 75%–85% of all bladder cancers, and muscle-invasive bladder cancer (MIBC), which accounts for 15%–25% of all bladder cancers [ ]. NMIBC is divided into low, intermediate, and high-risk groups according to the risk of recurrence and progression. Risk classification depends on the number of tumors, tumor size, prior recurrence rate, T category, presence of concurrent CIS, and tumor grade. Each risk category has its own treatment algorithm [ ]. Since nearly all muscle-invasive tumors undergo cystectomy, only nonmuscle-invasive tumors were included in this study.
The study included a total of 362 patients; we selected 126 patients with nonmuscle invasive (NMI) LGPUC, 33 patients with NMI MGUC, and 203 patients with NMI HGPUC from a total of 247 NMI LGPUC, 50 NMI MGUC, and 245 NMI HGPUC patients, respectively, from those who had available blocks and follow-up information. MGUC patients had the presence of less than 5% HG components within LGPUC, as suggested by the WHO 2022 classification. HGPUC patients had the presence of equal or greater than 5% HG components. These patients were obtained from bladder transurethral resection (TUR) specimens of patients diagnosed with UC between January 2007 and January 2021 at the pathology departments of Medeniyet University Goztepe Prof. Dr. Suleyman Yalcin City Hospital. The 40 cases of MGUC from Medeniyet University Goztepe Prof. Dr. Suleyman Yalcin City Hospital were also included in our previous study [ ]. Only patients with more than 2 months of follow-up were included. Basic clinical and pathological information, including age, gender, and presence or absence of recurrence, was collected from the database of the pathology clinic and institution. Adjuvant intravesical BCG treatment was administered to all patients with combine groups and PHGPUC except patients with LGPUC.
2.3
Pathological evaluation
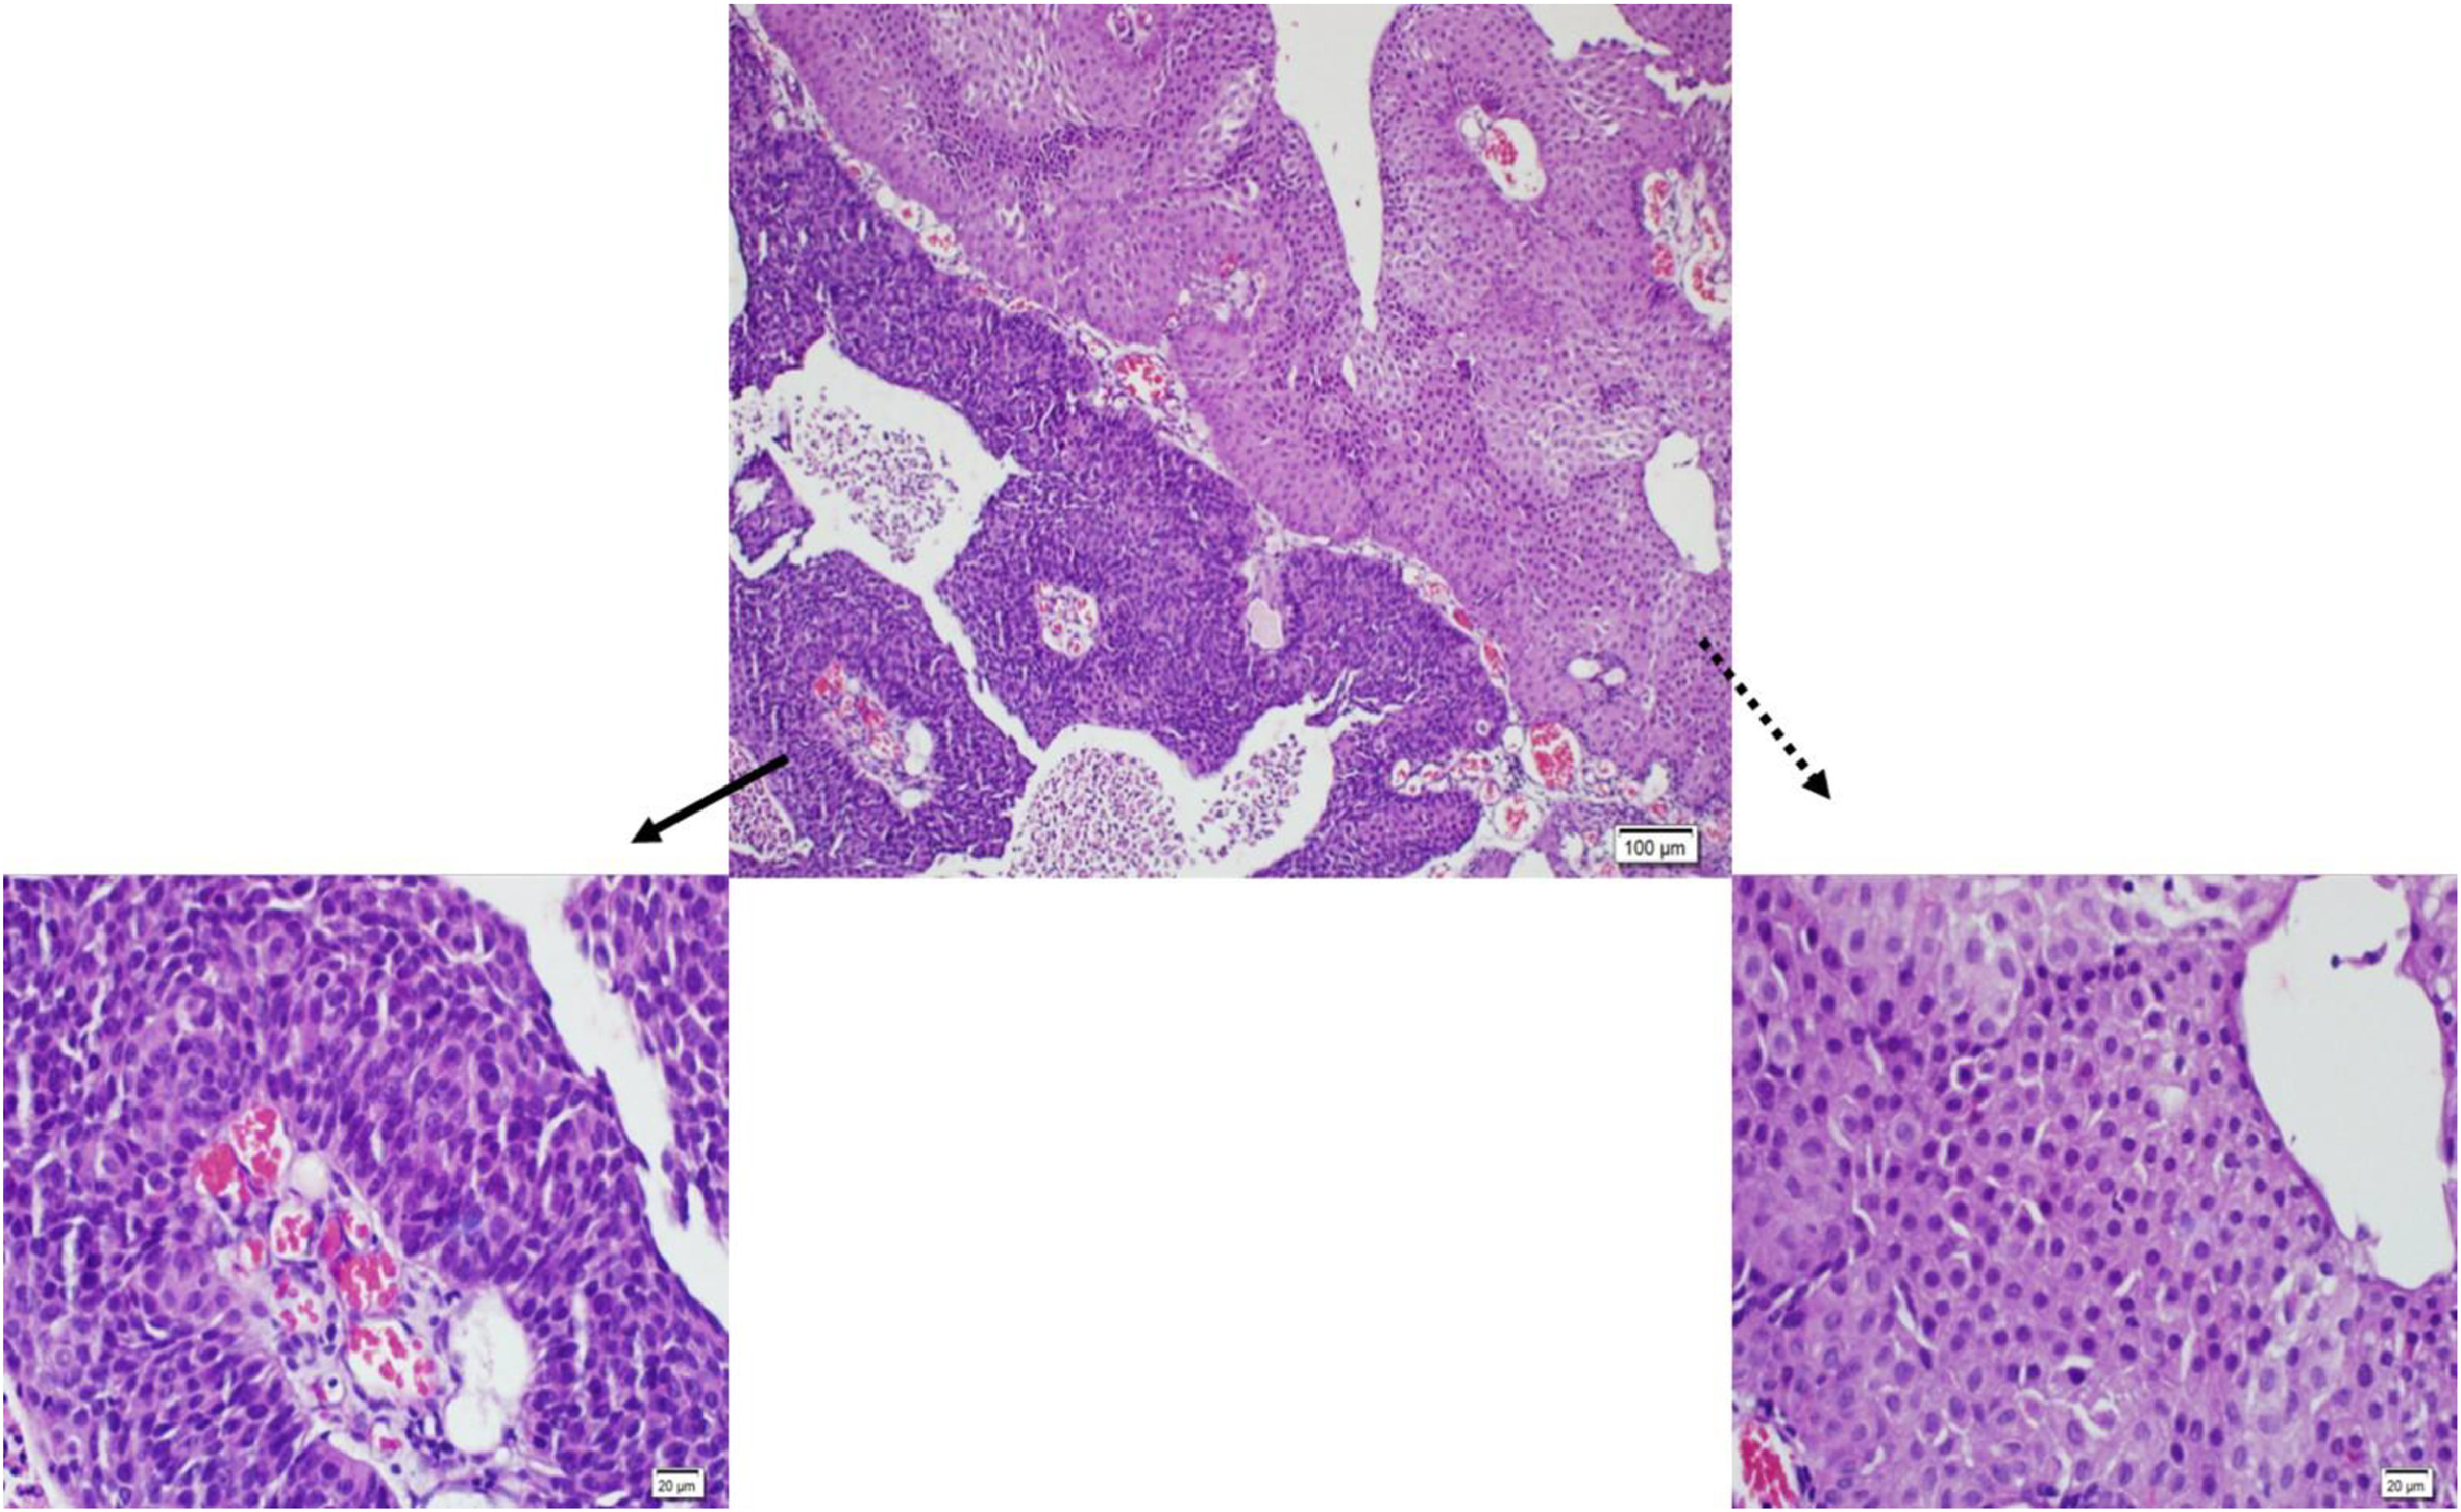
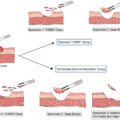
TUR of the bladder (TUR-B) specimens were fixed in 10% formaldehyde, and standard techniques were used to process and embed in paraffin. The whole specimen was sampled for histological examination. Hematoxylin and eosin (H&E) staining was performed on 4-µm sections for routine histology. H&E-stained slides of all patients were examined independently by three pathologists (GK, AA, and GEC) who were blinded to the patient’s outcomes. The cases were evaluated in 5 groups according to the percentage of HG components (0%, >0% to <5%, ≥5% to <50%, ≥50% to <100%, and 100%). Cases with discordance in the groups caused by at least 1 of these 3 pathologists were collectively examined using a multi-headed microscope. A consensus score agreed upon by three pathologists was then assigned. For all cases ( n = 362) interobserver agreement was 82% (Kappa: 0.83) Since the higher agreement was seen for the cases with 0% and 100% high-grade percentages, interobserver variability for combine groups was re-evaluated separately. For combine groups only ( n = 102) interobserver agreement was 66% (Kappa: 0.661). The patients that included any LGPUC areas within HGPUC patients were referred to as the combine group (CG). MGUC patients were classified as CG1 based on the presence of less than 5% HG areas. The HGPUC patients were categorized into groups depending on the proportion of HG components. These groups were defined as CG2 for patients with ≥5% to <50% HG components and CG3 for patients with ≥50% to <100% HG components. In cases where patients had 100% HG components, they were referred to as pure HGPUC (PHGPUC). The diagnosis of the HG component was based on the presence of architectural disorganization, nuclear size variation, hyperchromasia, irregular and pleomorphic nuclei, prominent nucleoli, and increased mitotic activity, within an otherwise LG component (i.e., relatively orderly architecture with preserved polarity and a low nuclear-to-cytoplasmic ratio) ( Fig. 1 ). All the HGPUC slides were stained with Ki-67 to distinguish between LG and HG areas. We have based the grading on morphology, but Ki-67 assisted in distinguishing between LG and HG areas. The positive expression of Ki-67 in LGPUC is primarily in the basal layer; however, increased expression is seen in HGPUC, covering larger areas at higher levels than the basal and parabasal layers of LGPUC [ ]. Semi-objective methods were used to quantify the HG component by calculating the percentage of the HG component/the total tumor area. We summed the percentage of each area, taking into account the intensely labeled regions with Ki-67. We calculated the percentage of HG components in the total tumor area.
The presence of concomitant carcinoma in situ (CIS), lamina propria invasion, histological subtype, and divergent differentiation were reassessed in all sections. CIS of the urinary bladder was defined as a flat lesion with thinned urothelium comprising cytologically malignant cells, either involving the full or partial thickness of the urothelium [ ]. Significantly thickened urothelium was excluded. Conflicted patients were stained with p53 and CK20 to support the diagnosis of CIS. Aberrant CK20 expression and mutation-type p53 expression were evaluated. If p53 was wild type, it was more likely to be a shoulder lesion, which indicates the intrusion of a previous HGPUC into the surface epithelium. A history of UC in the same area also favored the diagnosis of a shoulder lesion.
Recurrence was defined as any disease reappearance, and recurrence-free survival (RFS) was calculated from the date of diagnosis to recurrence, cancer-related death, or the end of follow-up. Cancer-specific survival (CSS) was calculated from the date of diagnosis to cancer-related death or the end of follow-up.
2.4
Immunohistochemistry
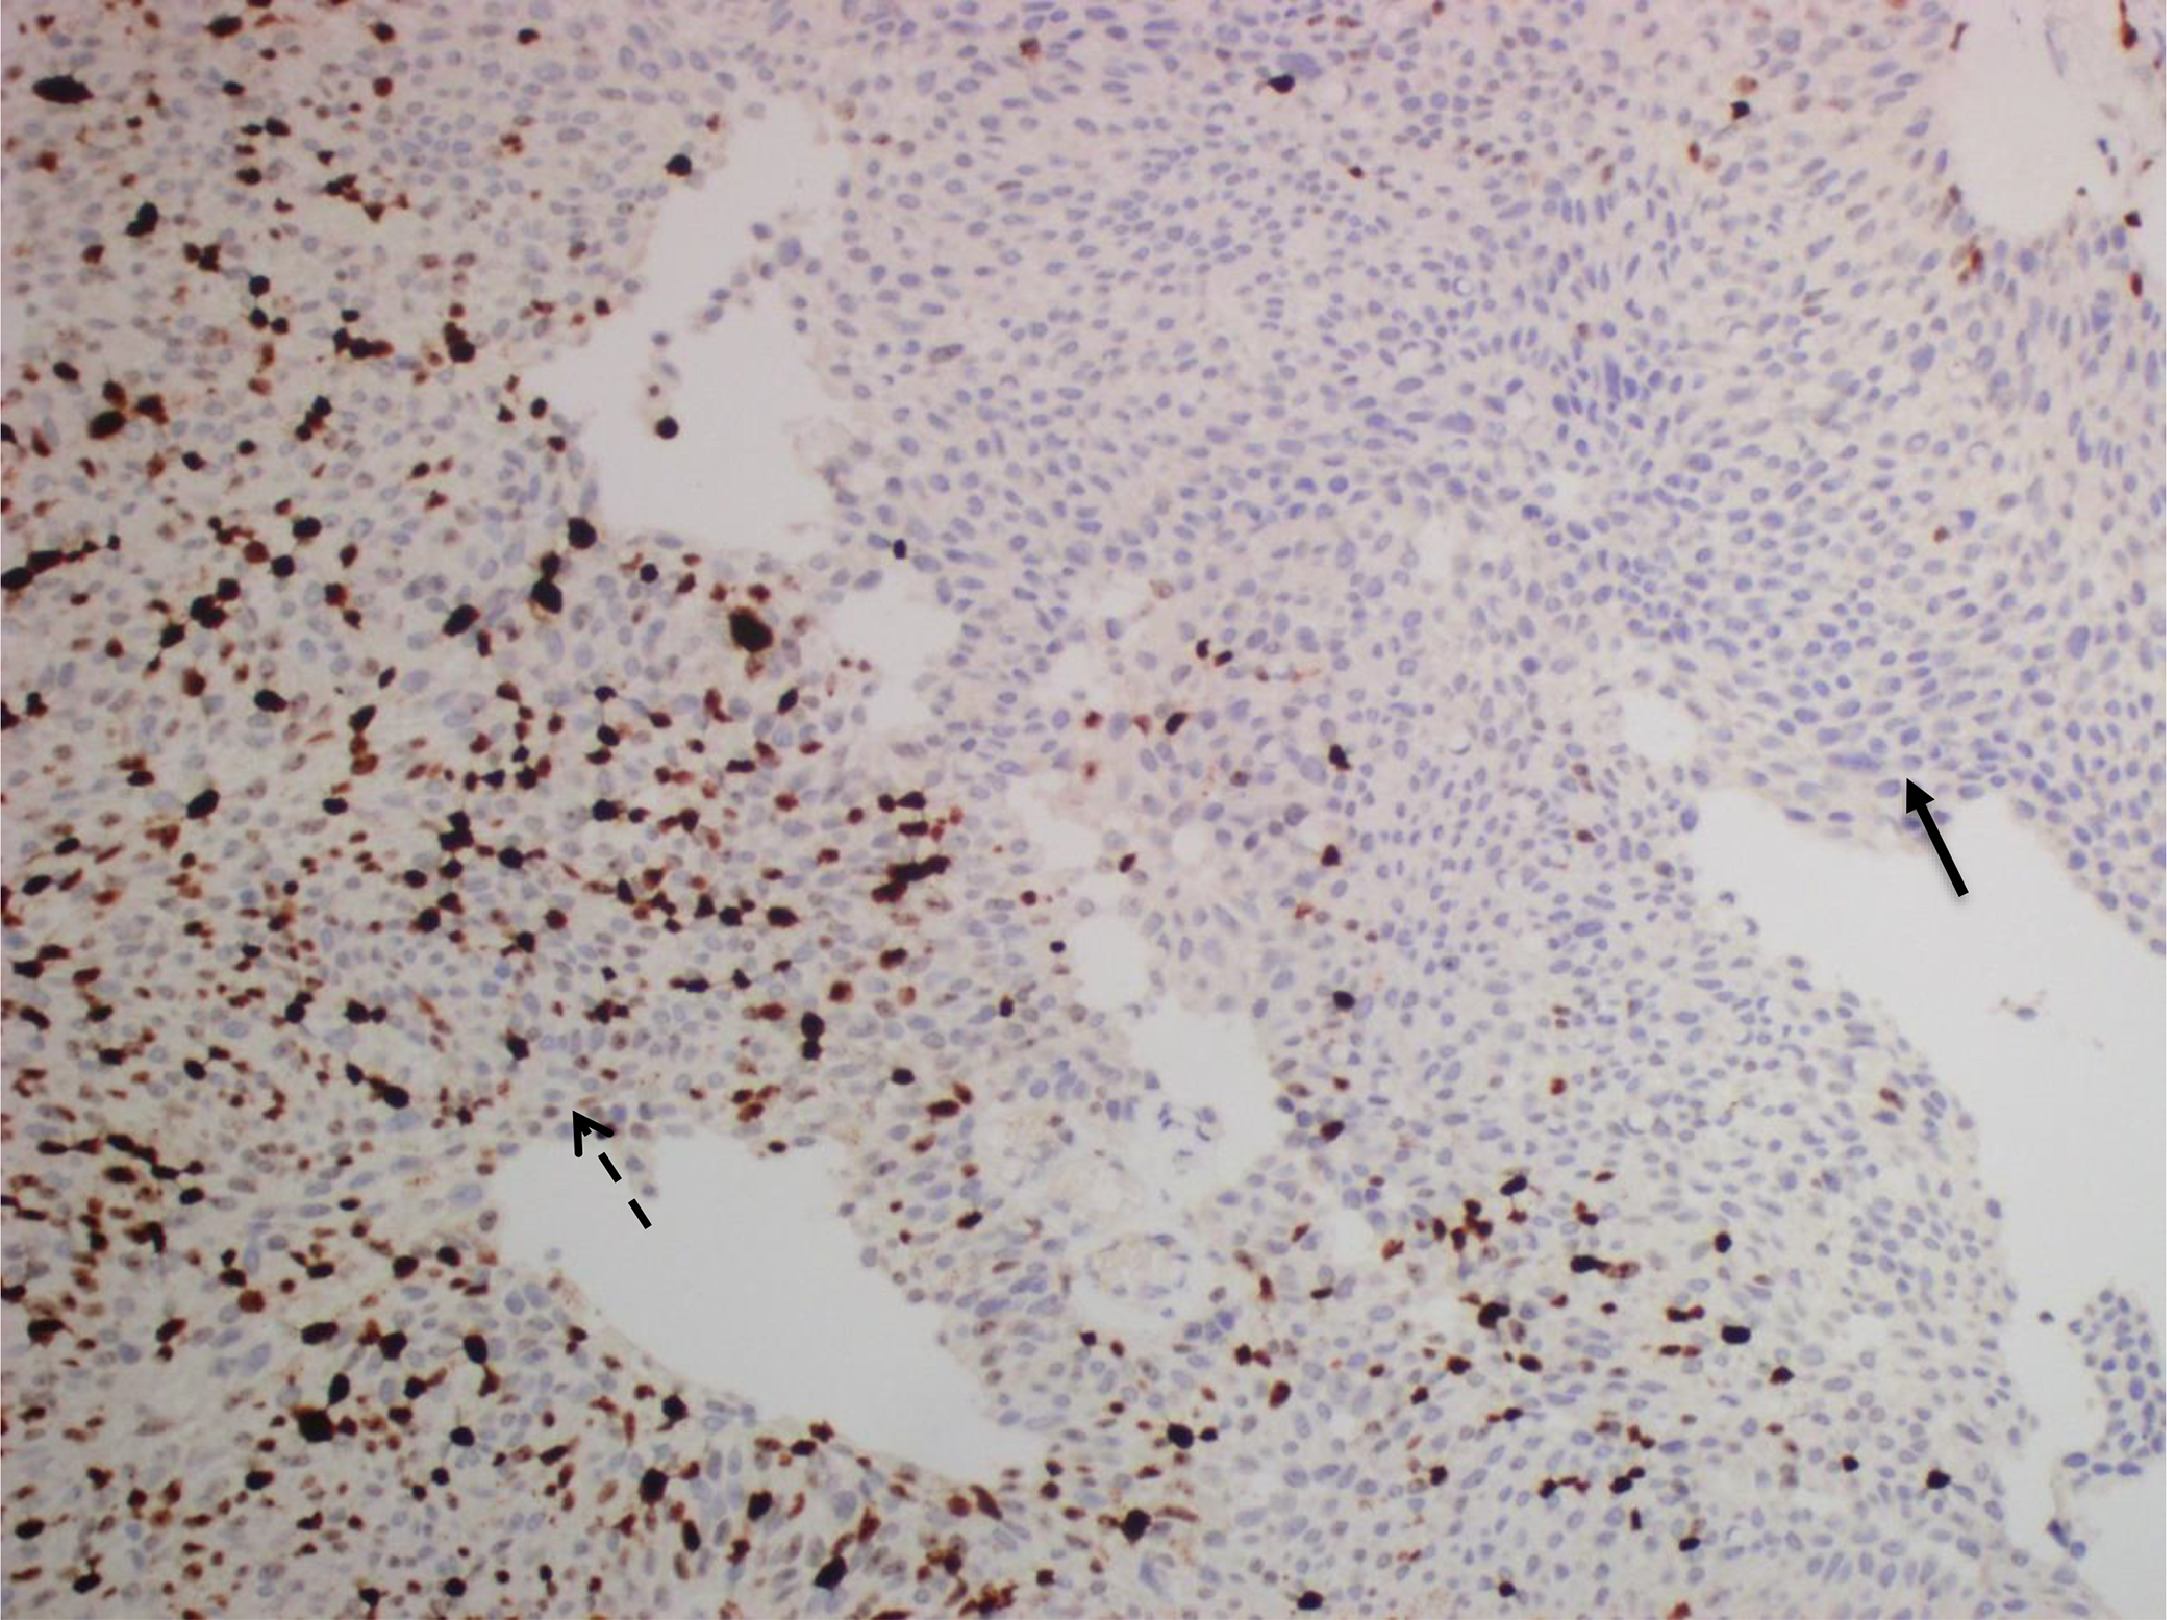
Immunohistochemistry (IHC) was performed on sections using a standard immunostaining protocol and the Leica BOND-MAX Detection System (Leica Biosystems, Germany) according to the manufacturer’s instructions. A representative block of tumor tissue was selected for IHC. 4 μm sections were cut from paraffin-embedded tumor blocks and stained with the Ki-67 antibody (Thermo Fisher, clone SP6, 1:200). For Ki-67 immunohistochemistry, the most intensely labeled regions, determined as hotspots at × 10 magnification, were selected on each immunolabeled slide ( Fig. 2 ). At least 1,000 cells were counted in hotspots at × 400 magnification, and tumor cells with nuclear staining were considered positive. Ki-67 expression was calculated as a percentage by dividing the number of Ki-67 positive cells by the total number of counted tumor cells. Normal lymphoid tissue sections were used as positive external controls for Ki-67 [ ].
2.5
Statistical analysis
Statistical analysis was performed using IBM SPSS Statistics for Windows, version 22.0. Continuous variables were presented as means, medians, and standard deviations. Categorical variables were analyzed using the contingency table with Pearson’s χ2 test. Continuous variables were analyzed using one-way ANOVA. A P -value of < 0.05 was considered statistically significant. Inter-rater reliability was assessed using Cohen’s Kappa analysis. Survival curves were generated using the Kaplan-Meier method and compared using the log-rank (Mantel-Cox) test. Multivariate Cox regression models, based on hazard ratio (HR) and 95% confidence interval (CI), were used to analyze time-to-event outcomes. Follow-up times were calculated from the date of the first TUR-B specimens to the date of cancer-related death or the end of follow-up in April 2021.
3
Results
3.1
Patient demographics
The clinicopathologic characteristics of the study population are presented in Table 2 . There were no statistically significant differences in terms of age among LGPUC, CG, and PHGPUC ( P = 0.418). There were no statistically significant differences in terms of gender among LGPUC, CG, and PHGPUC ( P = 0.932). Statistical analysis did not reveal any statistically significant differences in the length of follow-up time among LGPUC, CG, and PHGPUC groups ( P = 0.076). In addition, there were no statistically significant differences in the length of follow-up time and age among LGPUC, CG1, CG2, CG3, and PHGPUC ( P = 0.227 and P = 0.748, respectively).
Related posts:
 Is primary retroperitoneal lymph node dissection the way forward for patients with testicular seminoma and limited retroperitoneal metastases?
 Critical care therapy and in-hospital mortality after radical nephroureterectomy for nonmetastatic upper urinary tract carcinoma
 Cumulative smoking exposure impacts oncologic outcomes of upper tract urothelial carcinoma
 Immediate second resection versus restage transurethral resection of bladder tumor: A prospective randomized clinical trial (IMMERSE trial)
 The fragility index of randomized controlled trials in advanced/metastatic renal cell cancer
 Pathologic prostate cancer grade concordance among high-resolution micro-ultrasound, systematic transrectal ultrasound and MRI fusion biopsy
Stay updated, free articles. Join our Telegram channel

Full access? Get Clinical Tree


