Highlights
- •
Critical care therapy represents a 5- to 6-fold multiple of in-hospital mortality rate. Moreover, critical care therapy very closely reflects in-hospital mortality rate changes that occurred over time span.
- •
Temporal critical care therapy, invasive mechanical ventilation, and total parenteral nutrition trends very closely followed in-hospital mortality trends.
- •
Decreases in critical care therapy rates that are paralleled by decreases of in-hospital mortality may be interpreted as a favorable quality of care indicator.
Abstract
Background
Use of critical care therapies (CCT), that include invasive mechanical ventilation (IMV), total parenteral nutrition (TPN) and other modalities are unknown after radical nephroureterectomy (RNU) for upper urinary tract carcinoma (UUTC). Their relationship with in-hospital mortality is also unknown.
Methods
Within the National Inpatient Sample (2008–2019), we identified non-metastatic UUTC patients treated with RNU. Multivariable logistic regression models were used.
Results
Of 8,995 patients, 375 (4.2%) received CCT and 82 (0.9%) experienced in-hospital mortality. Of CCT modalities, 215 (2.4%) received IMV and 139 (1.5%) TPN. Temporal CCT, IMV, and TPN trends very closely followed in-hospital mortality trends. Relative to historical UUTC patients (2008–2013), contemporary (2014–2019) patients exhibited lower CCT (Δ = 2.2%, P value < 0.0001), lower IMV (Δ = 1.4%, P < 0.0001), lower TPN (Δ = 2.2%, P < 0.0001), and lower in-hospital mortality (Δ = 0.4%, P = 0.03) rates. Of in-hospital mortalities, 52 out of 82 received CCT but 30 of 82 did not. Median age (> 72 years; odds ratio [OR] 1.4; P = 0.002) and Charlson comorbidity index ≥ 3 (OR 4.1; P < 0.001) and ≥ 1-2 (OR 1.7; P = 0.001) independently predicted overall higher CCT, IMV, TPN, and in-hospital mortality.
Conclusion
After RNU, CCT rates parallels in-hospital mortality rates. CCT represents a 5 to 6-fold multiple of in-hospital mortality rate. In RNU patients, CCT rates are higher in older and sicker individuals. Lower CCT rates that are paralleled by lower in-hospital mortality may be interpreted as an indicator of improved quality of care. Ideally all in-hospital mortalities should be predated by CCT exposure.
1
Introduction
Radical nephroureterectomy (RNU) represents the standard of care for non-metastatic upper urinary tract carcinoma (UUTC) [ , ]. RNU represents a major oncological surgery [ , ]. As all major oncological surgery, a small albeit important proportion of RNU patients may experience in-hospital mortality [ ]. Patients at-risk of in-hospital mortality usually benefit of critical care therapy (CCT) [ , ]. In consequences, CCT rates may represents a valid indicator of patients at-risk of in-hospital mortality. This hypothesis has already been explored in bladder cancer (BCa) [ ] but, unfortunately, no previous authors have investigated RNU. We addressed this knowledge gap and tested CCT rates after RNU. Within CCT modalities, we focused on invasive mechanical ventilation and total parenteral nutrition use, as previous authors did for BCa [ ]. To study the potential relationship between CCT and in-hospital mortality, we also examined in-hospital mortality rates. To test these hypotheses, we relied on a large-scale population-based cohort of nonmetastatic UUTC RNU patients within the United States.
2
Methods
2.1
Data source
Within the National Inpatient Sample (NIS 2008–2019), we tested for rates and patterns of overall CCT use as well as specific CCT modalities, namely invasive mechanical ventilation (IMV), total parenteral nutrition (TPN), percutaneous endoscopic gastrostomy tube, dialysis for acute kidney failure or tracheostomy, and in-hospital mortality after RNU. The NIS is a set of longitudinal hospital inpatient databases included in the Healthcare Cost and Utilization Project and formed by the Agency for Healthcare Research and Quality through a Federal-State partnership [ ]. All diagnoses and procedures were coded using the International Classification of Disease (ICD) 9th revision Clinical Modification (ICD-9-CM), ICD 10th revision Clinical Modification (ICD-10-CM), as well as ICD 10th revision Procedure Coding System (ICD-10-PCS).
2.2
Study population
We included patients aged ≥ 18 years with a primary diagnosis of UUTC (ICD-9-CM codes 188.6–188.9,189.1, 189.2, and ICD-10-CM code C65.0–C65.2, C66.0–C66.2, C66.9). Only patients treated with RNU were included according to previously reported methodology [ ]. Patients with a diagnosis of metastatic stage (ICD-9-CM codes 196.x, 197.x, 198.x, and ICD-10-CM codes C77.x, C78.x, C79.x) were excluded from the study cohort.
2.3
Definition of variables for analyses
Overall CCT use and in-hospital mortality represented the primary study endpoints in RNU patients with non-metastatic UUTC. Critical care therapies were identified with ICD-9 and ICD-10 codes based on previously established methodology [ , ]. The Deyo modification of CCI was used to account for comorbidities [ ]. We relied on coding algorithms for defining comorbidities in ICD-9-CM and ICD-10-CM codes by Quan et al. [ ]. Covariates consisted of median age (categorically coded: ≤ 72 vs. > 72 years), sex (male vs. female), CCI (0 vs. 1–2 vs. ≥3), surgical approach (open vs. minimally invasive), teaching hospital status (teaching vs. nonteaching), and hospital size (large [≥ 400 beds] vs. medium [200–399 beds] vs. small [< 200 beds]).
2.4
Statistical analyses
First, rates of overall CCT use as well as of specific CCT modalities, in addition to in-hospital mortality rate were tabulated. Pearson Chi-square and Fisher’s exact tests assessed the statistical significance in proportions’ differences. For all variables, frequencies and proportions were recorded. According to the number of comparisons, 2-, 3-, or 4-sample tests for equality of proportions were applied. Second, univariable and multivariable logistic regression models (LRM) predicting overall CCT use as well as specific CCT modalities, and in-hospital mortality were fitted after adjustment for clustering at the hospital level using generalized estimation equation methodology. Statistical analyses and their reporting followed the NIS guidelines [ ]. All tests were 2 sided, with a significance level set at P < 0.05. R software environment was used for statistical computing and graphics (R version 4.2.2; R Foundation for Statistical Computing, Vienna, Austria).
3
Results
3.1
Descriptive characteristics of the overall study population
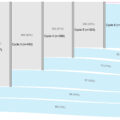
Relying on the NIS (2008–2019), we identified 8,995 patients with non-metastatic UUTC who underwent RNU ( Table 1 ). Of those, 375 (4.2%) patients benefitted of CCT and 82 (0.9%) died during their hospital stay ( Fig. 1 ). According to CCT modalities, 215 (2.4%) patients received IMV and 139 (1.5%) received TPN ( Fig. 1 ). Other CCT modalities, such as percutaneous endoscopic gastrostomy tube, dialysis for acute kidney failure or tracheostomy all accounted for less than 1% of all CCT modalities.
| Characteristic | Overall, N = 8,995 a | Critical care therapy, N = 375 (4.2%) a | P -value b | Invasive mechanical ventilation, N = 215 (2.4%) a | P -value b | Total parenteral nutrition, N = 139 (1.5%) | P -value b | In-hospital mortality, N = 82 (0.9%) | P -value b | |
|---|---|---|---|---|---|---|---|---|---|---|
| Median age, n (%) | ≤72 | 4,638 (52%) | 149 (3.2%) | < 0.001 | 86 (1.9%) | <0.001 | 54 (1.2%) | 0.003 | 21 (0.5%) | < 0.001 |
| >72 | 4,357 (48%) | 226 (5.2%) | 129 (3.0%) | 85 (2.0%) | 61 (1.4%) | |||||
| Sex, n (%) * | Males | 5,509 (61%) | 237 (4.3%) | 0.4 | 131 (2.4%) | 1 | 86 (1.6%) | 0.9 | 63 (1.1%) | 0.004 |
| Charleson Comorbidity Index, n (%) | 0 | 3,056 (34%) | 58 (1.9%) | < 0.001 | 28 (0.9%) | <0.001 | 35 (1.1%) | < 0.001 | 15 (0.5%) | < 0.001 |
| 1-2 | 3,295 (37%) | 110 (3.3%) | 61 (1.9%) | 43 (1.3%) | 24 (0.7%) | |||||
| ≥3 | 2,644 (29%) | 207 (7.8%) | 126 (4.8%) | 61 (2.3%) | 43 (1.6%) | |||||
| Hospital status , n (%) | Teaching hospitals | 6,100 (68%) | 234 (3.8%) | 0.02 | 131 (2.1%) | 0.02 | 81 (1.3%) | 0.01 | 52 (0.9%) | 0.4 |
| Non-teaching hospitals | 2,895 (32%) | 141 (4.9%) | 84 (2.9%) | 58 (2.0%) | 30 (1.0%) | |||||
| Surgical approach , n (%) | Open | 6,086 (68%) | 279 (4.6%) | 0.004 | 152 (2.5%) | 0.3 | 116 (1.9%) | < 0.001 | 58 (1.0%) | 0.6 |
| Minimally-invasive | 2,909 (32%) | 96 (3.3%) | 63 (2.2%) | 23 (0.8%) | 24 (0.8%) | |||||
| Hospital size , n (%) ⁎⁎ | Large (≥400 beds) | 5,785 (64%) | 238 (4.1%) | 0.5 | 138 (2.4%) | 1 | 83 (1.4%) | 0.04 | 49 (0.8%) | 0.7 |
Related posts:
 Is primary retroperitoneal lymph node dissection the way forward for patients with testicular seminoma and limited retroperitoneal metastases?
 Guidelines versus real-world data in metastatic bladder cancer: A population-based study on first-line chemotherapy treatment patterns
 Cumulative smoking exposure impacts oncologic outcomes of upper tract urothelial carcinoma
 Immediate second resection versus restage transurethral resection of bladder tumor: A prospective randomized clinical trial (IMMERSE trial)
 The fragility index of randomized controlled trials in advanced/metastatic renal cell cancer
 Pathologic prostate cancer grade concordance among high-resolution micro-ultrasound, systematic transrectal ultrasound and MRI fusion biopsy
Stay updated, free articles. Join our Telegram channel

Full access? Get Clinical Tree


