Highlights
- •
The effect of 5-alpha reductase inhibitors on upper tract urothelial carcinoma has not been explored.
- •
Men taking 5-alpha reductase inhibitors were identified using Merative TM Marketscan®.
- •
Total of 4,761 patients were diagnosed with upper tract urothelial carcinoma.
- •
5-alpha reductase inhibitors did not protect from upper tract urothelial carcinoma.
- •
Alpha-blockers did not have protective effect on upper tract urothelial carcinoma.
Abstract
Background
Increasing data suggests that androgen receptor signaling may play an important role in the carcinogenesis of urothelial cancers. While the chemoprotective effect of 5-alpha reductase inhibitors (5-ARi) on bladder cancer risk in men with Benign Prostatic Hyperplasia (BPH) has been explored with conflicting results, the evidence regarding 5-ARi treatment, and the risk of incident Upper Tract Urothelial Carcinoma (UTUC) development is lacking. Therefore, our objective was to investigate the impact of the 5-ARi administration on the incidence of new UTUC cases using a large US database.
Methods
The Merative TM Marketscan® database was used to identify men ≥ 50 years old with a diagnosis of BPH and an active 5-ARi prescription between 2007 and 2021 and were subsequently matched with paired controls. A multivariable Cox regression model was implemented to ascertain the association of 5-ARi and/or alpha-blocker (α-B) medications on the incidence of UTUC. Additional subgroup analyses were conducted based on exposure risk (with a 2-year threshold) to investigate the relationship between 5-ARi and UTUC over time.
Results
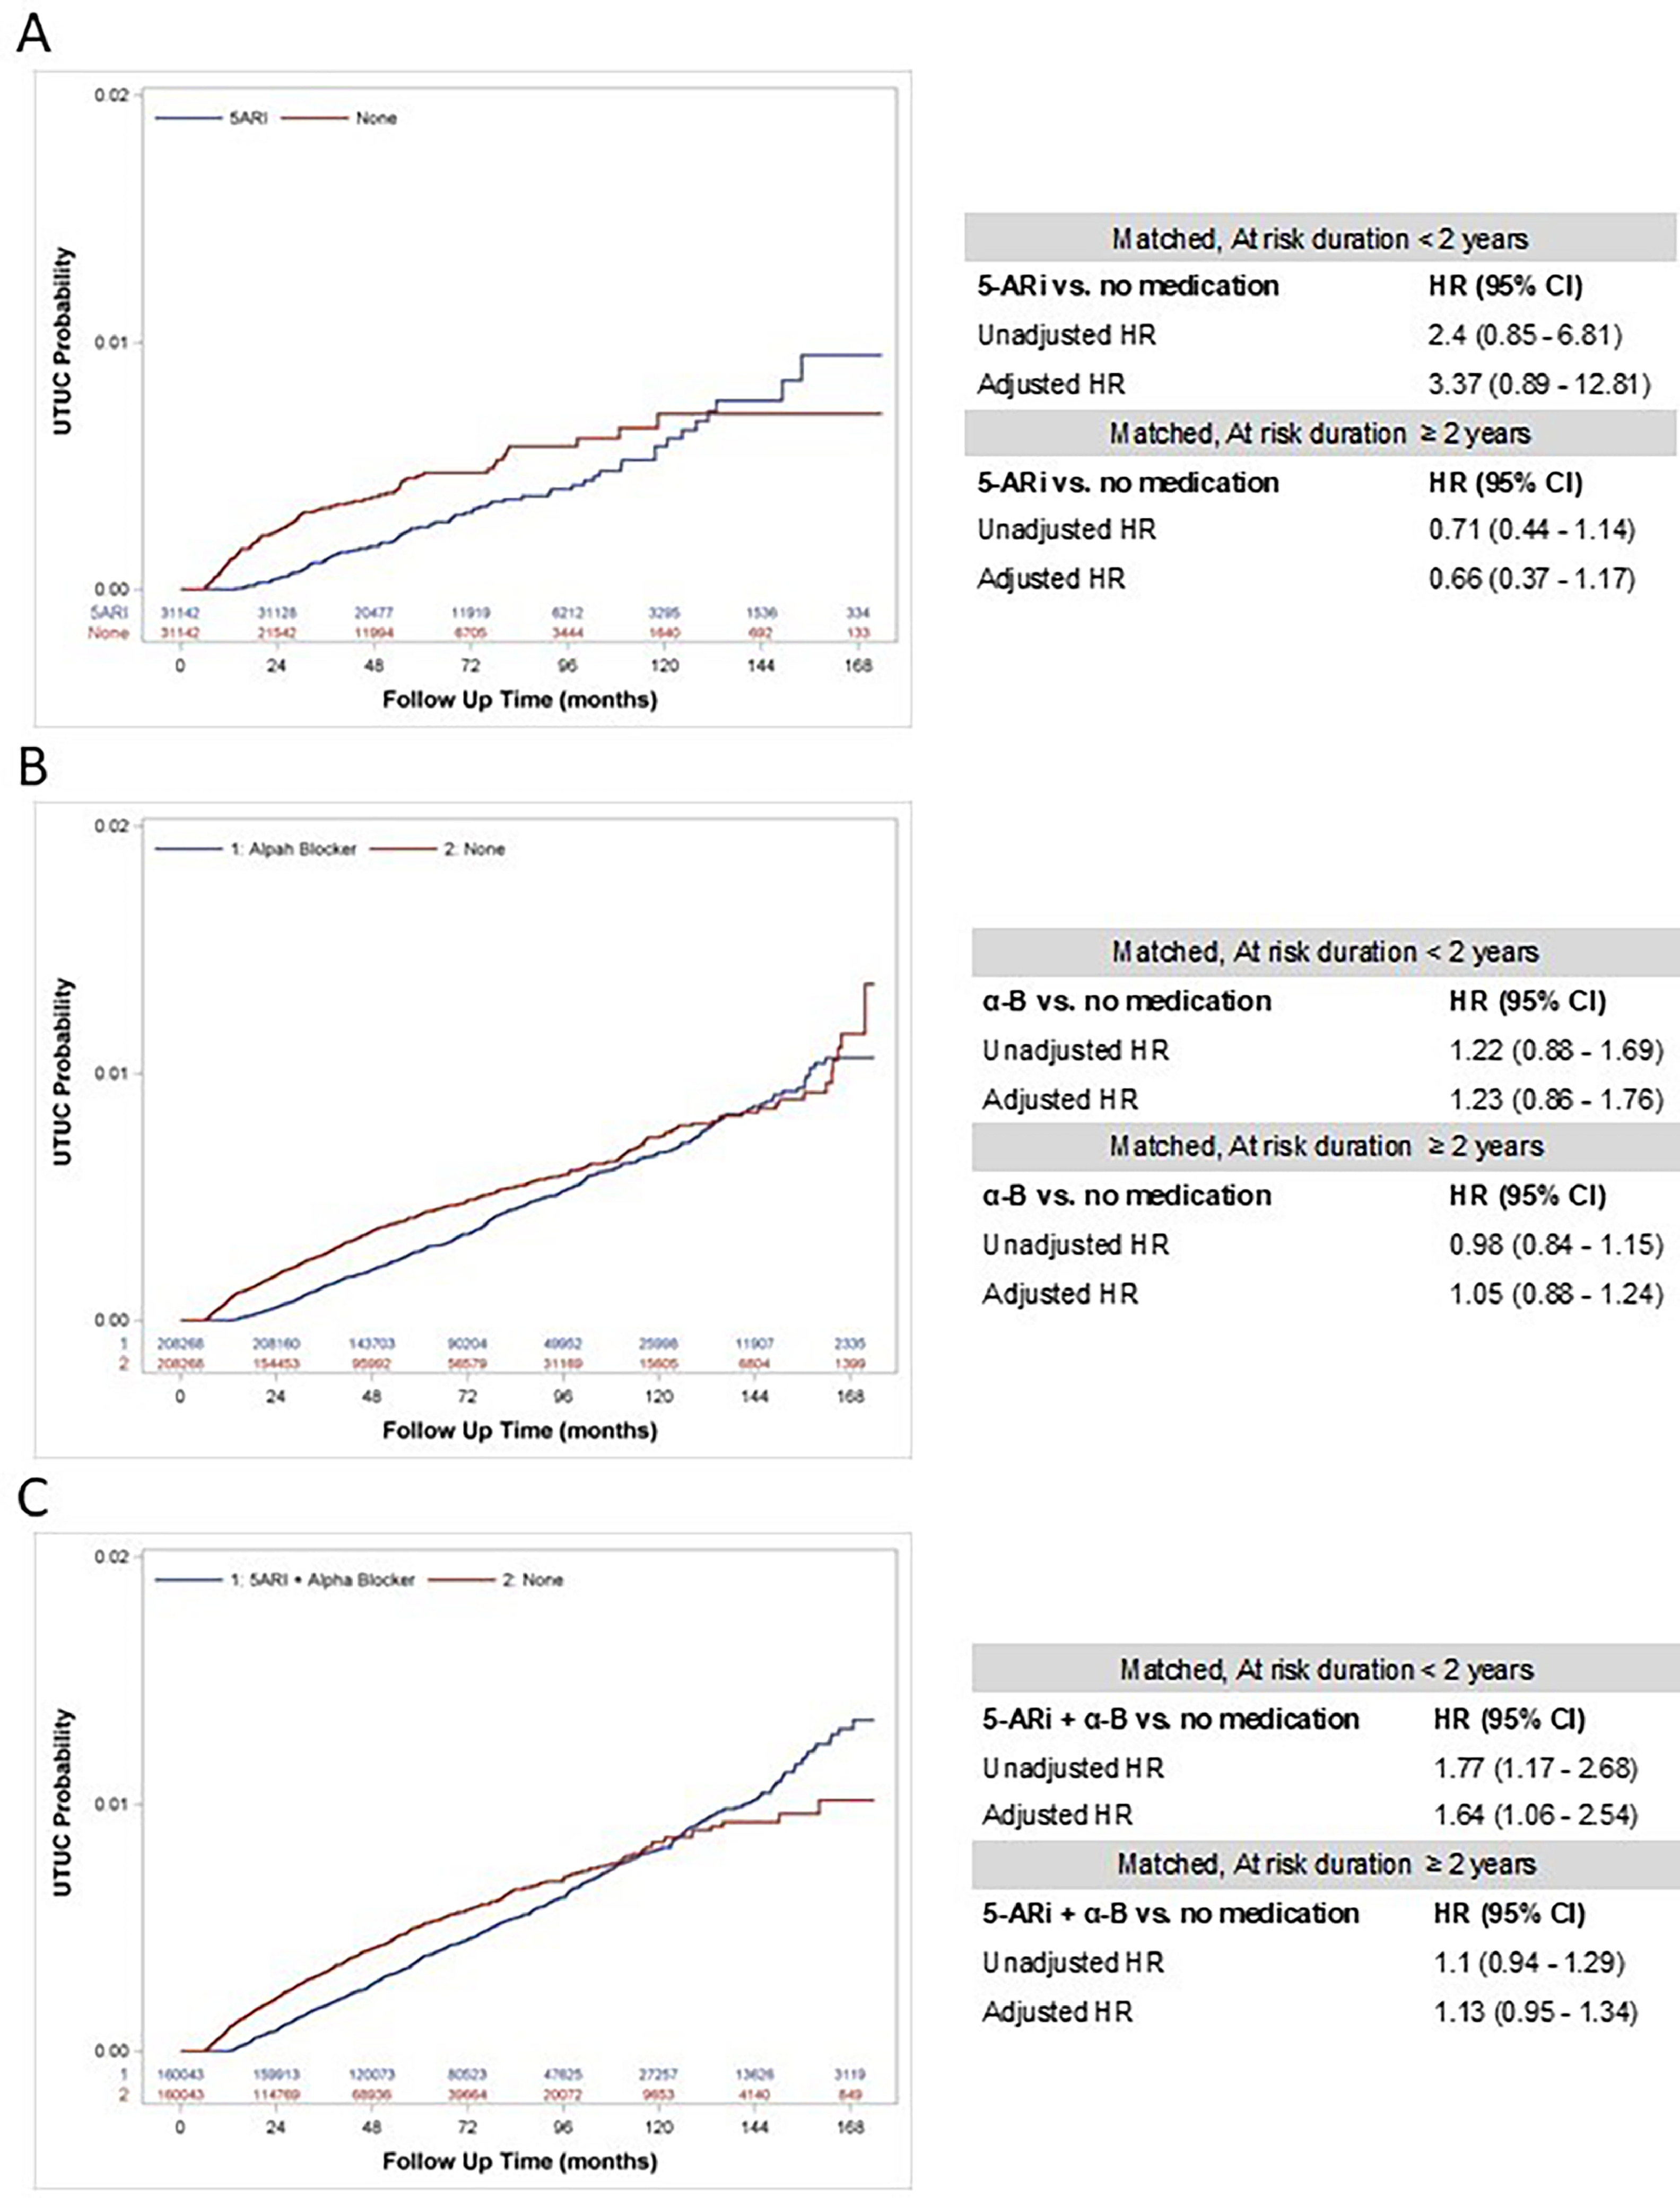
Overall, n=1,103,743 men BPH without prescriptions for BPH, n=31,142 men on 5-ARi, and n=160,049 using 5-ARi + α-B were identified. Over the follow-up period, a total of n=4,761 patients were diagnosed with UTUC. After matching, UTUC incidence ranged from 0.36% to 0.41% in men without active BPH therapy vs. 0.30% and 0.52% for the 5-ARi and 5-ARi + α-B groups, respectively. In multivariable analysis, the chemoprotective effect on UTUC risk was not observed for either 5-ARi monotherapy (adjusted hazard ratio [aHR]: 0.91, 95% CI: 0.58–1.44) or 5-ARi + α-B combination (aHR: 1.02, 95% CI: 0.87–1.19). This remained true for both short-term (≤ 2 years) and long-term (> 2 years) follow-up periods.
Conclusions
The use of 5-ARi for BPH, whether used alone or in combination with α-B, is not associated with incident UTUC.
1
Introduction
Upper tract urothelial carcinoma (UTUC) accounts for approximately 5% to 10 % of urothelial neoplasms, with an estimated annual incidence of 4,600 to 7,800 new cases in the United States (US) [ ]. UTUC refers to a type of cancer that originates in the renal pelvis, renal calices, or ureter [ , ]. Radical nephroureterectomy (RNU) with bladder cuff excision and template-based lymphadenectomy is a standard of care in patients with high-risk UTUC, regardless of tumor location [ , ]. The occurrence of UTUC reaches its highest rate in adults aged 70 to 90 years, and it is twice as prevalent in men than in women [ ]. The development of sporadic UTUC has been linked to several environmental factors, with tobacco smoking and aristolochic acid intake being the most established causative agents [ , ]. However, up to 10% of UTUC cases can be genetically attributed to hereditary nonpolyposis colorectal cancer (HNPCC), also known as Lynch syndrome, through mutations in DNA mismatch repair genes [ , ].
In recent years, there has been growing body of evidence regarding the diverse biological mechanisms and molecular pathways that may play a pivotal role in the carcinogenesis and progression of urothelial cancers. Both preclinical and clinical studies have indicated that androgen receptor (AR) signaling is associated with bladder cancer (BCa) tumorigenesis, which may reflect gender-specific differences in the incidence of BCa [ ]. It was postulated that inactivation of AR (e.g., in males on androgen suppression therapy [AST]) could potentially reduce the risk of sporadic BCa, as well as improve its oncological outcomes [ , ]. Consequently, patients with benign prostatic hyperplasia (BPH) receiving 5-alpha reductase inhibitors (5-ARi), drugs that hinder the conversion of testosterone to dihydrotestosterone (DHT), were thought to have a reduced risk of developing BCa [ ]. However, the association between 5-ARi and BCa in men with BPH is inconclusive, as several studies demonstrated no chemoprotective effect of such treatment on the incidence of BCa [ ]. In contrast, there is no information regarding the association between 5-ARi treatment in men with BPH and development of incident UTUC. Although UTUC and urothelial BCa share many common biological pathways, some key genetic differences have been identified. As such, the potential chemoprotective effect of AST on UTUC risk may vary from that of BCa.
Considering the prevalence of BPH and the concomitant use of AST in the US, our objective was to investigate the impact of the 5-ARi administration on the development of new UTUC cases using a large populational US database.
2
Materials and Methods
2.1
Data source
We conducted a retrospective cohort analysis utilizing administrative insurance claims data retrieved from Merative TM MarketScan® Research Commercial and Medicare databases (v 3.0, DOI: 10.57761/kg3j-nh50). These databases contain individual-level, de-identified, inpatient, outpatient, outpatient pharmacy insurance billing claims, which enable longitudinal tracking of patients regardless of different sites of care and multiple treatment years, as well as inpatient and outpatient treatment, demographic data, diagnoses, procedures, and costs. Both International Classification of Disease Ninth and Tenth Revisions, Clinical Modification (ICD-9-CM, ICD-10-CM) codes and Current Procedural Terminology (CPT) codes were applied to identify the study cohort, treatments, and concurrent medical conditions. This methodology has been used in other studies [ ] and owing to the completely de-identified characteristics of analyzed data, the present study was deemed exempt from the Institutional Review Board. Data for this investigation were accessed using the Stanford Center for Population Health Sciences Data Core. The PHS Data Core is supported by a National Institutes of Health National Center for Advancing Translational Science Clinical and Translational Science Award (UL1TR003142) and from Internal Stanford funding.
2.2
Patients
The cohort of interest was assembled by identifying men who were at least 50 years old with a diagnosis of BPH without concomitant active prescription of 5-ARi ± α-B between 2007 and 2021 based on corresponding ICD-9/10-CM and CPT diagnosis/treatment codes. Patients were enrolled in the database for at least 6 months before and 1 year after their initial BPH diagnosis. Medication codes (according to Marketscan® Data Dictionary) were employed to guarantee the consistency of 5-ARi and/or α-B for the BPH therapy, encompassing: Finasteride 5 mg; Finasteride 5 mg + Alfuzosin 10 mg; Dutasteride 0.5 mg, Dutasteride + Tamsulosin 0.4 mg; Alfuzosin 10 mg; Tamsulosin 0.4 mg; Silodosin 4 or 8 mg; Doxazosin 2 or 4 mg, Prazosin 0.5 or 1 mg; Terazosin 2 or 5 mg; Phenoxybenzamine 20 mg. The study population was subsequently categorized into sub-groups based on whether they were users of BPH medication (“non-BPH medication users” and “BPH-medication users”). BPH-medication users were further stratified on solely α-B or 5-ARi monotherapy, or a combination of 5-ARi plus α-B. We considered the first eligible period of usage per inclusion criterion. This method was employed to prevent the allocation of inaccurate exposure status in relation to the risk of subsequent UTUC diagnosis. The control group consisted of patients with BPH diagnosis and no evidence of using 5-ARi or α-B during the course of the study.
Sociodemographic data (age at BPH diagnosis, smoking status, US region), specific comorbidity prevalence, baseline Charlson Comorbidity Index score, follow-up data (i.e., exposure time), and clinically relevant factors (i.e., history of hematuria, performance of cystoscopy, performance of computed tomography [CT] or magnetic resonance imaging [MRI]) were collected for each patient.
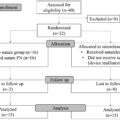
The incidence of primary UTUC diagnosis as confirmed by the ICD-9/10-CM codes was recorded following 6-months after index date in all subgroups. Patients who had been diagnosed with UTUC either before or within 6 months from the index date were excluded. Men with UTUC confirmed prior to or concurrently with their first BPH diagnosis were also excluded so that all UTUC diagnoses were primary diagnosis. A comprehensive list of ICD-9/10-CM and CPT codes is presented in Supplementary Table 1 while flow chart diagram summarizing the analytical steps for the data analysis along with the inclusion/exclusion criteria is presented in Fig. 1 .
2.3
Outcome Ascertainment
The main objective of the present study was to investigate the frequency of new UTUC cases in a large US cohort, assuming the use of 5-ARi alone or in combination with α-B for the BPH disease. Furthermore, we sought to determine if impeding the conversion of testosterone to DHT could potentially reduce the probability of developing UTUC (i.e., chemoprotective effects). Patients were tracked over a predefined at-risk period 6-months after the index date, allowing time for diagnosis of UTUC and any residual effects of 5-ARi after initiation. Finally, we did not account for discontinued 5-ARi periods or patients who restarted 5-ARi after the initial period of use to avoid misleading exposure-related effects on UTUC incidence.
2.4
Statistical analysis
Continuous variables were reported using means ± standard deviations (SDs) or medians and inter-quartile ranges (IQR). Categorical variables were presented as counts and percentages (%). A propensity score matching (PSM) with a 1:1 matching was conducted within each “BPH-medication users” sub-groups: 5-ARi alone, α-B alone, and 5-ARi plus α-B. The PSM was based on adjustments for clinically relevant factors such as age at index date, CCI score, smoking status, and concomitant diabetes.
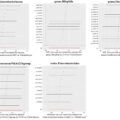
Kaplan–Meier curves were created to investigate the impact of 5-ARi and/or α-B on the timing of subsequent UTUC diagnosis. A conditional multivariable Cox proportional hazards regression models were also employed to ascertain the association of 5-ARi and/or α-B utilization in men with BPH on the further risk of developing UTUC. All Cox regression analyses were adjusted for urologic-specific confounders including history of hematuria, performance of urine cytology, performance of cystoscopy with or without biopsy, and performance of CT or MRI. This assessment was conducted for the entire cohort and then repeated after re-matching the cohort based on data of patients with shorter or longer-term follow-up time (i.e., less than 2 years vs. 2 years or more). This follow-up time threshold is considered biologically reliable for assessing risk exposure and has been used in previous series.
All analyses were 2-sided with p < 0.05 considered as significant, and was conducted using statistical software SAS, version 9.4 (SAS Institute Inc., Cary, NC, USA.).
3
Results
3.1
Study Cohort
Overall, n = 3,495,360 patients with BPH diagnosis (based on ICD-9/10 codes) were identified from 2007 to 2021. Among these, n = 1,506,809 had a minimum of 6 months of enrollment time prior to and 1 year following the BPH diagnosis. After the exclusion of n = 3601 men who had UTUC before or within 6 months after the index date, n = 1,503,208 individuals were included in the final cohort ( Supplementary Fig. 1 ).
Within the final cohort, the control group (non-BPH medication users) consisted of n = 1,103,743 (73.42%) patients who were not receiving any prescriptions for BPH treatment. Of the remaining n = 399,465 patients (BPH medication users), the majority of men were treated with α-B alone (n = 208,274, 52.14%), while n = 31,142 (7.80%) individuals received solely 5-ARi. The combination of both α-B and 5-ARi was administered to n = 160,049 (40.07%) men. Table 1 presents the sociodemographic and clinical characteristics of the analyzed cohort, as well as follow-up data with regards to the matched (after PSM) population.
| Variables | Propensity Score Matched Cohort (Ratio 1:1) | |||||
|---|---|---|---|---|---|---|
| No medication | α-B | No medication | 5-ARi | No medication | 5-ARi + α-B | |
| Sample size , n (%) | 208.268 | 208.268 | 31.142 | 31.142 | 160.043 | 160.043 |
| Age at index date , mean (SD) | 65.8 (10.0) | 65.8 (10.0) | 67.4 (10.2) | 67.4 (10.2) | 67.9 (10.1) | 67.9 (10.1) |
| Age at index date , quartile distribution, n (%) | ||||||
| 1st quartile | 47855 (22.98) | 47855 (22.98) | 7914 (25.41) | 7914 (25.41) | 38446 (24.02) | 38446 (24.02) |
| 2nd quartile | 56549 (27.15) | 56549 (27.15) | 7505 (24.1) | 7505 (24.1) | 39795 (24.87) | 39795 (24.87) |
| 3rd quartile | 53797 (25.83) | 53797 (25.83) | 8149 (26.17) | 8149 (26.17) | 41249 (25.77) | 41249 (25.77) |
| 4th quartile | 50067 (24.04) | 50067 (24.04) | 7574 (24.32) | 7574 (24.32) | 40553 (25.34) | 40553 (25.34) |
| Enrollment time before index date , years, median (IQR) | 2.5 (1.2–4.5) | 2.3 (1.1–4.1) | 2.5 (1.2–4.5) | 2.3 (1.1–4.2) | 2.0 (1.0–3.8) | 1.7 (0.9–3.2) |
| Follow-up after index date , years, median (IQR) | 3.7 (2.0–6.3) | 5.4 (3.6–7.8) | 3.7 (2.0–6.3) | 5.4 (3.6–7.9) | 3.1 (1.8–5.4) | 5.0 (3.4–7.3) |
| US Region , n (%) | ||||||
| Northeast | 36943 (17.74) | 36842 (17.69) | 5490 (17.63) | 6361 (20.43) | 30598 (19.12) | 28877 (18.04) |
| North Central | 59156 (28.4) | 62047 (29.79) | 8136 (26.13) | 8495 (27.28) | 44620 (27.88) | 48517 (30.31) |
| South | 70400 (33.8) | 72935 (35.02) | 11166 (35.86) | 10833 (34.79) | 52879 (33.04) | 54307 (33.93) |
| West | 39735 (19.08) | 34901 (16.76) | 6115 (19.64) | 5151 (16.54) | 30408 (19) | 27239 (17.02) |
| Unknown | 2034 (0.98) | 1543 (0.74) | 235 (0.75) | 302 (0.97) | 1538 (0.96) | 1103 (0.69) |
| CCI score , median (IQR) (range) | 1 (0–2) (0–22) | 1 (0–2) (0–19) | 1 (0–2) (0–18) | 1 (0–2) (0–18) | 1 (0–2) (0–22) | 1 (0–2) (0–20) |
| 0 | 87696 (42.11) | 87696 (42.11) | 15521 (49.84) | 15521 (49.84) | 70709 (44.18) | 70709 (44.18) |
| 1 | 45986 (22.08) | 45986 (22.08) | 6576 (21.12) | 6576 (21.12) | 35826 (22.39) | 35826 (22.39) |
| 2 | 26644 (12.79) | 26644 (12.79) | 3561 (11.43) | 3561 (11.43) | 20157 (12.59) | 20157 (12.59) |
| 3+ | 47942 (23.02) | 47942 (23.02) | 5484 (17.61) | 5484 (17.61) | 33351 (20.84) | 33351 (20.84) |
| Prevalent comorbidities at index date , n (%) | ||||||
| Cancer | 95822 (46.01) | 92901 (44.61) | 13376 (42.95) | 13834 (44.42) | 72095 (45.05) | 69685 (43.54) |
| Cardio-vascular disease | 152572 (73.26) | 157176 (75.47) | 21982 (70.59) | 22048 (70.8) | 117028 (73.12) | 118304 (73.92) |
| Hypertension | 122516 (58.83) | 130724 (62.77) | 17677 (56.76) | 17523 (56.27) | 94014 (58.74) | 95385 (59.6) |
| Diabetes | 56154 (26.96) | 56154 (26.96) | 6603 (21.2) | 6603 (21.2) | 40425 (25.26) | 40425 (25.26) |
| Hyperlipidemia | 119929 (57.58) | 120052 (57.64) | 16601 (53.31) | 17101 (54.91) | 88812 (55.49) | 85355 (53.33) |
| Renal disease | 17110 (8.22) | 18410 (8.84) | 2116 (6.79) | 1881 (6.04) | 12515 (7.82) | 12580 (7.86) |
| Chronic pulmonary disease | 37510 (18.01) | 39097 (18.77) | 4634 (14.88) | 4346 (13.96) | 27493 (17.18) | 28405 (17.75) |
| Liver disease | 12028 (5.78) | 11707 (5.62) | 1343 (4.31) | 1159 (3.72) | 7891 (4.93) | 7287 (4.55) |
| Depression | 14551 (6.99) | 17697 (8.5) | 1890 (6.07) | 1622 (5.21) | 10223 (6.39) | 10790 (6.74) |
| Peripheral vascular disease | 25393 (12.19) | 25596 (12.29) | 3205 (10.29) | 3102 (9.96) | 19465 (12.16) | 19534 (12.21) |
| Cerebrovascular disease | 28269 (13.57) | 28755 (13.81) | 3654 (11.73) | 3603 (11.57) | 21752 (13.59) | 21889 (13.68) |
| Heart disease | 50793 (24.39) | 53120 (25.51) | 7022 (22.55) | 7327 (23.53) | 40370 (25.22) | 41571 (25.97) |
| Infectious diseases | 50864 (24.42) | 51881 (24.91) | 6865 (22.04) | 6327 (20.32) | 37611 (23.5) | 36991 (23.11) |
| Smoking , n (%) | 13061 (6.27) | 13061 (6.27) | 1122 (3.6) | 1122 (3.6) | 7246 (4.53) | 7246 (4.53) |
| AST exposure , (yr), median (IQR) | 0.51 (0.09–1.03) | 0 (0–0) | 0.54 (0.09–1.09) | 3.59 (2.42–5.58) | 0.54 (0.08–1.06) | 2.51 (0.82–4.80) |
| AST exposure , n (%) | ||||||
| 0 | 4250 (23.04) | 0 (0) | 630 (21.13) | 0 (0) | 3442 (22.28) | 14729 (9.2) |
| 0–0.9 | 9301 (50.42) | 0 (0) | 1469 (49.28) | 0 (0) | 7695 (49.8) | 29685 (18.55) |
| 1–1.9 | 4864 (26.37) | 0 (0) | 878 (29.45) | 4115 (13.21) | 4281 (27.71) | 22042 (13.77) |
| 2–2.9 | <11 | 0 (0) | <11 | 7913 (25.41) | 12 (0.08) | 24278 (15.17) |
| 3 + | >11 | 0 (0) | <11 | 19114 (61.38) | 21 (0.14) | 69309 (43.31) |
| No. of UTUC diagnosis during follow-up , n (%) | 767 (0.37) | 778 (0.37) | 111 (0.36) | 94 (0.3) | 649 (0.41) | 832 (0.52) |
| UTUC/1000-person-yr | 0.81 | 0.62 | 0.88 | 0.53 | 0.94 | 0.79 |
| UTUC with concomitant BCa , n (%) | 489 (0.23) | 515 (0.25) | 77 (0.25) | 55 (0.18) | 414 (0.26) | 549 (0.34) |
| History of hematuria , n (%) | 14724 (7.07) | 13480 (6.47) | 2084 (6.69) | 2515 (8.08) | 10851 (6.78) | 10805 (6.75) |
| Performance of urine cytology , n (%) | 1772 (0.85) | 1861 (0.89) | 217 (0.7) | 259 (0.83) | 1318 (0.82) | 1332 (0.83) |
| Performance of cystoscopy , n (%) | 545 (0.26) | 532 (0.26) | 66 (0.21) | 77 (0.25) | 382 (0.24) | 376 (0.23) |
| Performance of cystourethroscopy with biopsy/ fulguration/TURBT , n (%) | 2045 (0.98) | 1727 (0.83) | 286 (0.92) | 281 (0.9) | 1538 (0.96) | 1314 (0.82) |
| Performance of CT/MRI , n(%) | 53087 (25.49) | 54495 (26.17) | 6886 (22.11) | 6452 (20.72) | 38906 (24.31) | 38845 (24.27) |
Related posts:
 Tumor involvement of the trigone and urethra at the time of robot-assisted radical cystectomy is associated with adverse oncological outcomes
 Diet and the microbiome as mediators of prostate cancer risk, progression, and therapy response
 Understanding the microbiome as a mediator of bladder cancer progression and therapeutic response
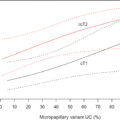 Quantification of micropapillary component on transurethral resection is associated with likelihood of occult lymph node metastasis at radical cystectomy
 Laparoscopic suture-free partial nephrectomy using argon-beam-coagulator: Surgical technique and outcomes of a single-center, open-label randomized controlled trial
 Causal relationship between bladder cancer and gut microbiota contributes to the gut-bladder axis: A two-sample Mendelian randomization study
Stay updated, free articles. Join our Telegram channel

Full access? Get Clinical Tree


