Fig. 19.1
Representative image of a spheroid showing the key features. MCF7 cells seeded at 5000 cells per well in a 96-well ULA plate exhibited a tight spheroid after 96 h. The necrotic core (N), proliferating region (PR), and the quiescent cell layer (Q) are shown along with an overlay showing the relative distribution of gas (O2) and nutrients (e.g., glucose) across the spheroid (adapted from [2]). In the gradient the lighter color represents highest gas and nutrient concentrations, while darker colors represent lowest amounts
By 1990, spheroids were being used to study drug combinations with clinical potential [36]. Drugs such as topoisomerase II inhibitors (etoposide), topoisomerase I inhibitors (camptothecin), and cell cycle-specific agents (5-fluorouracil) were studied in V79 cell spheroids in comparison with V79 cell mono-layers. Only the topoisomerase II inhibitor etoposide was equally cyto-toxic to the cells grown in both formats, while the spheroids were less responsive to the other drugs [37]. A series of bio-reductive hypoxic cell-selective agents including misonidazole, mitomycin C, porfiromycin, and tirapazamine (SR-4233) produced less cyto-toxicity toward spheroid inner cells than expected from hypoxic mono-layer experiments [38]. This was likely due to poor penetration into the spheroid core or to rapid metabolism by the cells.
EMT6 mouse mammary carcinoma tumors were made resistant to cisplatinum, carboplatinum, cyclophosphamide, or thiotepa in vivo by treatment of tumor-bearing mice with the drug over a 6-month period [39]. Although the tumors were highly resistant in vivo, the cells from the resistant tumors were not resistant to the drugs when grown as monolayers. In the absence of treatment, the drug resistance of the cancer-cell lines decreased over 3–6 months, indicating that resistance was not due to a permanent genetic change. When the drug-resistant cancer cells were grown as spheroids, the drug resistance was partially retained, indicating the cell-cell contact of the 3D spheroid structure provided more of the environment of tumors in vivo than did mono-layer cultures [40, 41]. In a study using the EMT6 mouse mammary tumor and in vivo alkylating agent-resistant sublines of EMT6, there were clear gene expression differences between the cells grown in mono-layer and the same cells grown as spheroids [42]. Decreased DNA mismatch repair appeared to be a factor in the reversible multi-cellular resistance in the in-vivo resistant lines.
Further emphasizing that cell-cell contact is an important factor in response, small spheroids exposed to ionizing radiation, hyper-thermia, photo-dynamic therapy, or topoisomerase II inhibitors are less responsive than the same cells in mono-layer [43]. Four human ovarian cancer cell lines were used to compare the effects of paclitaxel and cisplatinum when the cells were grown as spheroids or mono-layers [44]. While cisplatinum was equally cyto-toxic to the cells grown as spheroids or as mono-layers, the cancer-cell spheroids were less responsive to paclitaxel than were the same cells exposed to the drug in mono-layer. In the mono-layer cultures, paclitaxel exposure resulted in accumulation of cells in G2-M phases and apoptosis. However, this was not seen in the spheroid cultures. The proteasome-inhibitor bortezomib was tested in the same four ovarian carcinoma cell lines and had equal or greater activity in the cells grown as spheroids than in the cells grown as mono-layers [45].
Angiogenesis is an important factor in tumor growth, and vascular-endothelial growth factor (VEGF) is a major pro-angiogenic growth factor in vivo. Human HT-29 colon carcinoma cells grown as spheroids were examined for hypoxia and for the expression of VEGF [46, 47]. VEGF expression was localized mainly to interior spheroid cells that were hypoxic, as determined by staining with the bio-reductive probe EF5. When the longevity of hypoxic tumor cells was examined in spheroids, a range of 3–5 days was observed; while in human tumor xenografts, the range was 4–10 days, indicating that in both models, the hypoxic cells live long enough to be a therapeutic problem [48]. The von Hippel-Lindau (VHL) tumor-suppressor gene is mutated in most renal-cell carcinoma tumors and cell lines. When grown as spheroids, human 786-0 renal cell carcinoma cells (which have a mutant VHL gene) form compact, cohesive clusters. When the same cells were genetically engineered to produce normal VHL, the cells grew more slowly and produced spheroids that were more loosely aggregated [49].
3D Cell-Based Models for Drug Discovery
There is a need for cell-based assays that can be used to determine the activity of compounds that can translate into leads and candidates for clinical use in cancer. The National Cancer Institute has had the NCI-60 screen in place for the past 20+ years to screen compounds for cyto-toxicity toward cancer cells. The NCI-60 assay uses cells in mono-layer (or suspension) to evaluate the effect of submitted compounds on viability. The 60-cell line panel includes nine cancer histologies (non-small cell lung, breast, prostate, colorectal, ovarian, renal, CNS, melanoma, and leukemia/lymphoma) [50]. While similar assays have been used in biotechnology companies, pharmaceutical companies, and elsewhere, it has become clear that these mono-layer cell-based assays may not be optimal for compound selection. For drug discovery, screening compounds in 3D-culture models rather than mono-layer culture is an effort to move to a model closer to the patient. Many essential cellular functions that are present in tissues are absent in mono-layer cultures, thus limiting the usefulness of mono-layer cultures in the drug discovery process. However, it has been difficult to adapt multi-cellular spheroids to high-throughput screening [51]. Mayer et al. grew 17 gastric cancer cell lines from varied gastric cancer subtypes and found that 12 out of the 17 cell lines recapitulated some of the complexity of the parental tumors and expressed molecular markers consistent with the tumor of origin [52]. Growth-factor signaling pathways, proliferation, and differentiation operate better in 3D culture models than in mono-layer cultures [53]. It is preferable to observe 3D cultures over a time course to determine responses to compounds. Technologies have been adapted to examine changes in the size/diameter of spheroids either in suspension in gels or soft agar media and/or with use of dyes or stains [54]. The recognition that the gene expression in 3D spheroid cultures is more similar to that of tumor tissues than is gene expression of mono-layer cultures provided impetus for the pharmaceutical industry to establish spheroid-based compound screening platforms and protocols. The NCI-60 cell line panel representing the nine tumor types was one of the first cell-line panels integrated into a large-scale 3D spheroid screen [55]. The screening protocol from spheroid initiation, compound exposure, and endpoint determination was 7 days. With longer times, spheroid growth delay and re-growth could be observed. However, while utilization of 3D spheroids for compound screening is more complicated than screening with 2D mono-layers [56], 3D cell-spheroid models can now be applied to high-throughput assays due to the availability of hardware and consumables to readily support growth and analysis of cell-spheroids exposed to test compounds. Several spheroid-generation technologies have been developed including hanging-drop technologies, ultra-low attachment (ULA) plates, hydro-gel seeding, suspension growth, and micro-fluidic approaches [reviewed in 2].
Vinci et al. described a 3D spheroid high-throughput protocol involving the growth of a single spheroid per well in suspension culture in a 96- or 384-well format and using high-content imaging to assess the diameter of the spheroid and staining to determine viability of the cells [57]. In a similar protocol, single spheroids embedded in Matrigel™ allowed determination of the migration and invasion of cells as the spheroids increased in size or decreased in diameter due to treatment. Future challenges for large-scale integration of 3D spheroid models into high-throughput screening programs include growth of the spheroids, data collection, and availability of suitable endpoints, e.g., using high-content imaging [58]. However, while the driving force for pursuit of this approach is that 3D cell-based models, especially those including co-culture with stromal cells, may be more representative of the in-vivo tumor micro-environment and provide more robust data, reports on the use of such co-culture models are still limited.
In the early study of spheroids in the 1970s and 1980s, the effect of spheroid size (cell number per spheroid) on oxygenation, proliferation, drug penetration, and endpoint validity was recognized as a critically important variable. The effects of spheroid size differed from cell line to cell line depending upon the tightness of the cell clusters. In the high-throughput setting with many cell lines being screened, a single-time point post-plating of the cells is often selected. While many types of data including spheroid diameter, cell number per spheroid, and regional viability of cells in the spheroid can be collected in focused studies, it is difficult to apply these methods in the high-throughput setting, and the screen endpoint is most often an average ATP determination per well, limiting inferences on the cell sub-populations within the spheroid. Larger spheroids are more difficult to image using high-content imaging scanners due to limited light penetration and may require immuno-histochemical methods to visualize effects throughout the spheroid.
Among the normal processes in tumor growth is angiogenesis. Although much of tumor growth involves co-opting existing blood vessels, neo-angiogenesis is also common in tumors but is difficult to incorporate into cell models used in high-throughput screening programs. Varied substrates have been applied to mimicking the growth of blood vessels in 3D culture systems [59, 60]. In addition, tumor-immune system interactions have been investigated in 3D spheroid culture models [61]. 3D bio-printing of cells into 3D structures is being investigated at several centers for varied applications [62]. 3D bio-printing has been used to fabricate vasculature with a tight-confluent endothelial lining capable of supporting the viability of cells up to 5 mm away. Tumor cells and matrix can be printed around the vessel.
Most 3D cell-based screens have used well-established cell lines that were previously used as mono-layer screens. However, these cell lines may not provide sufficiently diverse genetic backgrounds to represent the heterogeneity of clinical disease. There is a drive to utilize early-passage cells derived from patients, in screens to determine whether more predictive models—be it mono-layer culture, mono-layer co-culture (e.g., with fibroblasts), or a spheroid model (cancer cells alone or as a co-culture with stromal cells)—can be developed. Empirical studies aimed at examining the power to predict activity in tumor-bearing mice of the same early-passage cell lines in mono-layer versus 3D cultures are required to determine which assay format is most applicable for use in future screening. Cell lines recently derived from tumors have been applied to screens and drug selection in both 2D and 3D assays [63]. Drug-resistant sublines prepared in cell culture (by exposing the cells in mono-layer to increasing concentrations of drug) have been compared with cell lines derived from the tumors of patients who have stopped responding to the same drug. Orlandi et al. showed that human breast cancer cell lines (MCF7) differed in response to idarubicin, a doxorubicin derivative, and its active metabolite when studied in 3D cultures versus 2D [64]. There were an apparent decrease in potency of the compound and the need for prolonged exposure in the 3D model. Friedrich et al. showed that the response of the human HT-29 colon-cancer cell line to irinotecan was different in 3D spheroid culture than in mono-layer culture, with the IC50 of the drug increasing >100-fold in the 3D model [55]. Furthermore, other antic-ancer drugs had reduced efficacy because of slow drug penetration into the spheroid or so-called “multi-cellular” resistance [11, 42, 65].
Some of the changes in drug sensitivity observed may be due to the extra-cellular matrix and microenvironment surrounding the cells. Multi-cellular tumor spheroids derived from human TC32 and TC71 Ewing’s-sarcoma cells varied in their response to the compound LY294002 and anti-cancer drugs based on the expression of a dominant-negative form of E-cadherin or the wild-type protein [66]. In human SKOV3 serous ovarian-carcinoma cells, increased expression of two transcripts of Kallikrein-related peptidase (KLK7) enhanced spheroid formation through integrin-mediated adhesion. Spheroids of the SKOV3 subline over-expressing KLK7 were less sensitive to paclitaxel than parental SKOV3 spheroids [67]. In other studies, the ratio of pannexins (Panx1 to Panx2; a class of gap-junction proteins) may determine the degree of compaction of cell aggregates by remodeling the actin cytoskeleton, and this structural alteration may modulate drug sensitivity [68].
Newer Cell Lines: Patient-Derived Xenograft (PDX) Cells
Many early 3D models used in high-throughput screening programs were developed with well-established cell lines that had traditionally been grown in mono-layer culture [50]. While these 2D and 3D culture models provided well-controlled experimental systems to determine the effects of the change in cell culture format on compound response, the well-established cell lines were not sufficient to represent the heterogeneity of human cancers [55]. To address this issue, there have been several large efforts to develop new cell lines recently derived from patients and to develop new xenograft models recently derived from patients. Because patient-derived xenografts (PDX) and patient-derived cell lines have a shorter history in mice or cell culture, they maintain more of the genetic variations exhibited in the clinical disease and may be models that can successfully inform the best therapeutic option for treatment of the tumor type from which they were derived [69–74].
3D Assays Allow Extended Compound Exposure
While many DNA- and tubulin-interactive agents exert cyto-toxic effects on cells during short exposure times (48–72 h), many targeted drugs and compounds require multiple cell doublings to manifest their cytotoxicity. Examples include the epigenetic modifiers that alter DNA methylation. To accurately assess the effects of these agents in a high-throughput screen requires that the cells be exposed to the compounds for 5–10 days (depending upon cell doubling time). In a mono-layer culture system, well-established cell lines frequently have doubling times between 17 and 36 h. Since many high-throughput screening assays are performed in flat-bottomed multi-well plates, long compound-exposure times can result in over-confluent cell growth in control wells, resulting in invalid endpoint readings. While initial seeding density can be reduced, for assays which extend >10 days, after ~ 10 doublings slight variations in the initial cell plating number can result in marked variations in the cell number at assay endpoint, resulting in highly variable data that is difficult to interpret. Indeed, depending on spheroid size, it is sometimes necessary to extend the compound exposure time of spheroids to achieve a response similar to that observed in 2D cultures of the same cells [55, 64].
Spheroid models may more closely mimic the tumor micro-environment than mono-layer cultures. Depending on spheroid size and the lipophilicity of the test compound, reduced drug penetration can occur in these models. Similarly, contact-induced multi-drug resistance, hypoxia, and glycolytic metabolism may also be observed in spheroids [75, 76]. Furthermore, since it is well established that cellular gene expression profiles in 3D spheroids more closely mimic those in tumor specimens than do 2D mono-layers, 3D spheroids may be better models for compound testing [77–80].
Spheroid cell number, volume, and tightness are important variables in compound testing [81]. Erlanson et al. examined drug penetration, distribution, and retention in spheroids of a human glioma line and a human colon carcinoma line after 15–30 min exposure to drugs [65]. Properties of the drug, the spheroids, and the cells affected the uptake and retention of doxorubicin, actinomycin D, and cytosine arabinoside (ara-C) in the spheroids. In some cases, compounds accumulated in the spheroids [65]. 3D tumor spheroids differ in sensitivity to cytotoxic agents such as 5-fluorouracil, cisplatinum, and doxorubicin depending upon cell type and propensity to form a dense extracellular matrix [40, 42, 82, 83]. Because of these features of multicell spheroids, the hope is that 3D cell culture models applied in high-throughput screening drug discovery programs will be better predictors of compounds likely to have activity in human tumor models and thus improve upon the current success rates of cancer drug discovery. However, these models require an appropriate assay format to identify compound activities of interest.
3D Assay Endpoints
Many 2D mono-layer culture screens for compound testing relied on measures of viability to determine activity. Sulforhodamine B (used in the NC-I60 screen) is not readily applicable to 3D multicell spheroid models [84]. Fluorescent dyes such as MTT may be of limited use since, depending upon spheroid size, the dye may not reliably penetrate all of the cells during the time course of the assay [85]. Furthermore, the fluorescence intensity of vital fluorescent dyes can be affected by the penetration of the dye into the spheroid. Similarly, depending upon the intensity of the light source, spheroid density may reduce uniform access of excitation light in the spheroid as well as the amount of emitted light. Luminescence assays (e.g., measurement of ATP levels using Cell Titer-Glo (Promega, Madison, WI) or ATPlite (PE, Waltham, MA)) provide useful measures of cell viability in 2D culture systems, and with a suitable detection system, the wide dynamic range of these techniques provides a robust output at very low numbers of viable cells [86]. Recently, the Cell Titer-Glo assay was adapted for use in 3D spheroids (Cell Titer-Glo 3D). Increasing the cell-lysis capability of the assay solution and increasing the concentration of the luminescence substrate (to efficiently measure released intracellular ATP) allowed this assay to be used for quantitation in spheroid models [87, 88]. However, the assay is limited by producing a single average reading per well; thus, information regarding sub-populations of cells in the spheroid is lost. In co-culture models, an average reading per well does not differentiate between different cell types, and in the presence of high numbers of stromal cells, the killing of cancer cells may be missed. Consequently, cancer cells and stromal cells have been genetically engineered to express molecular markers such as luciferase to distinguish between them [89]. In addition, high-content imaging can be used to examine parameters such as morphology changes in the cells upon compound exposure, and these techniques may prove valuable when applied in parallel with viability endpoints, making screens with 3D multicell spheroids more complex than traditional 2D mono-layer culture screens but more informative regarding cell fate [55, 58]. In publications examining spheroids using these high-content screening approaches, it was evident that 3D spheroids may actually exhibit greater sensitivity to some compounds than could be observed in 2D cultures of the same cells [56, 88, 90, 91]. However, by pre-selecting spheroids of a given size prior to compound addition, it is possible to obtain useful information from cytotoxicity data alone [81, 88].
Fibroblast and Stromal Effects on Sensitivity to Drugs
Fibroblasts are an essential component of the stromal cell population, and they may affect cancer cell sensitivity to therapeutic compounds in a number of ways. Fibroblasts secrete collagen and other proteins that are part of the extra-cellular matrix (ECM) surrounding cells. Extra-cellular matrix proteins provide a barrier for access to cancer cells by potential therapeutics. In addition, fibroblasts secrete growth factors that can alter drug sensitivity through paracrine signaling between the fibroblasts and the cancer cells [92]. To better replicate the tumor micro-environment in cell-based assays, several studies examined inclusion of fibroblasts and other stromal components in 3D multi-cell spheroid assays. Spheroids formed from human mesenchymal stem cells and human umbilical-vein endothelial cells (HUVEC) can develop primitive vascular structures. Drug sensitivity in these complex spheroid models compared favorably with the drug sensitivity of the same cells grown as human tumor xenografts [93].
Interest in 3D cell-based assays is being driven by the recognition that compound failure in moving from mono-layer cell-based assays to human tumor xenograft assays was high. To allow implementation of 3D cell-based screens in high throughput, manufacturers have developed varied proprietary plasticware options so that 3D spheroids can be grown and/or assayed using a variety of endpoints. Plasticware that allows cancer cells and/or stromal cells to be grown as spheroids in 384-well hanging-drop plates has demonstrated utility in testing compounds for potential oncology applications [56, 94]. Hydro-gel-based systems (including agarose and alginate scaffolds) allow capture of cells in micro-droplets of the matrices, and micro-wells punched into an agarose scaffold promote spheroid formation [95, 96]. The agarose and alginate micro-spheres are transparent and, at very small diameters, allow diffusion of compounds and detection reagents into the multi-cell spheroids. In the agarose micro-wells, spheroids with differing size demonstrated varying sensitivity to test compounds, with larger spheroids being less responsive than smaller spheroids.
High-content imaging agents could readily be applied in both of these systems [95, 96]. Ultra-low attachment U-bottomed plates (96- or 384-well) coated with polyHEMA, or a similar hydrophobic matrix, allow 3D multi-cell spheroid generation and automated compound testing, since the plates conform to a standard Society for Biomolecular Screening (SBS) compliant format and are compatible with high-throughput screening instrumentation such as cell dispensers, plate washers, and plate readers. ULA plates have been used to categorize the morphologies of spheroids and to compare compound sensitivities of cells in 3D versus the same cells as mono-layer cultures [97]. Other methods for spheroid production include bioreactor technologies applied to generation of large numbers of spheroids, as well as micro-fluidic technologies that can generate and test very small spheroids [2, 95].
The success of the multi-cell spheroid models in predicting response to a test compound in human tumor xenografts depends on several factors: spheroid growth (size at time of compound addition and percent of cells actively dividing), duration of compound exposure, and appropriate endpoint and data analysis. Results obtained from a 3D multi-cell spheroid screen are only as valuable as the representative nature of the cells and other components used in generating the spheroids and the assay endpoints. Well-established cell lines such as the NCI-60 cell line panel can provide valuable information on compound response in 3D assays and can provide a valuable bridge between 2D and 3D assays to elucidate the strengths and weaknesses of each assay format [97]. The NCI-60 cell lines can be propagated in routine cell culture flasks and have been extensively characterized at the level of DNA for mutations, methylation, and copy number, at the level of RNA for gene expression and microRNA expression and at the protein level. Furthermore, a large database of assay results (from compounds tested in the classic 2D mono-layer culture screen using the sulforhodamine B readout) has been developed over a considerable time [50]. Consequently, the NCI-60 cell lines have been grown as spheroids in 96-well U-bottomed ULA plates [97]. Spheroid growth is critically dependent upon the number of cells plated at time zero. MCF7 human breast carcinoma cells and HT-29 human colon carcinoma cells plated at numbers from 50 cells to 10,000 cells per well grow widely-varying spheroids in 72 h (Fig. 19.2). Spheroids can be tightly adhered spheres or loose clusters. Cell lines from each of the nine tumor types represented in the NCI-60 cell line panel develop spheroids of varying tightness. The spheroids grown from the NCI-60 cell lines have been classified into groups depending upon the characteristic growth pattern of that cell line (Fig. 19.3a, b). There is no tumor-type panel that produced uniform spheroids; thus, heterogeneity in the spheroid growth characteristics does not depend upon the tumor of origin but varies from cell line to cell line in each of the nine tumor panels (Fig. 19.3c). To examine the differential sensitivity of HT-29 human colon carcinoma cells grown in mono-layer and grown as spheroids to an anticancer agent, the topoisomerase 1 inhibitor topotecan was tested. The concentration response curve for HT-29 cells exposed to topotecan for 72 h in mono-layers gave an IC50 of 0.11 μM (Fig. 19.4a). However, the same cells grown as spheroids had an IC50 of 0.9 μM, a nearly ninefold decrease in sensitivity. The HT-29 colon carcinoma spheroids were tracked over a time course for response to topotecan plus/minus the ATR inhibitor VE-821 (1 μM) using calcein AM to mark the live cells and ethidium homodimer to mark the dead regions of the spheroid (Fig. 19.4b). The fluorescent images show that with increasing concentrations of topotecan and longer duration of exposure, the cells in the interior and the periphery of the spheroids are dying. VE-821 further increased the degree of cell killing observed, and this was validated by data on cell viability measured using Cell Titer-Glo 3D [where exposure to the combination demonstrated a substantial decrease in luminescence (Fig. 19.4c)].
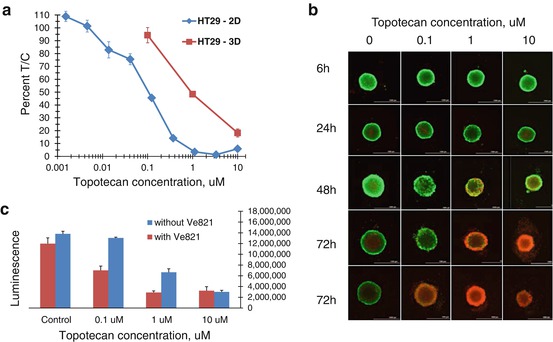
Fig. 19.2
Spheroid images for MCF7 human breast cancer cells panel (a) and HT-29 human colon carcinoma cells panel (b) showing spheroids initiated with varied cell numbers after 72 h of incubation. Cells were plated into 96-well U-bottomed ultra-low attachment plates, and spheroids were allowed to grow for 72 h. Cell numbers plated are below each image. After 72 h, the ATP content of each well was determined using Cell Titer-Glo 3D (Promega). ATP content was measured as luminescence. Error bars are the SD from four independent determinations
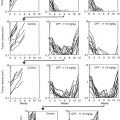
Fig. 19.3
NCI-60 cell line panel spheroid morphologies and classification based upon tightness of the cell cluster. Panel (a): examples of spheroids from NCI-60 cell lines representing each of the nine tumor types covered by the panel classified into groups by spheroid tightness. Panel (b): table showing the cell line (cell number) and group classification for the spheroids shown in panel (a). Panel (c): bar chart showing the distribution of spheroids classified by tightness for the NCI-60 cell line panel for the nine tumor types covered by the panel
Fig. 19.4
Panel (a): concentration response curves for HT-29 human colon carcinoma cells grown in mono-layer (2D) or as spheroids (3D) exposed for 72 h to varied concentrations of topotecan. The experimental endpoint was ATP determination using Cell Titer-Glo. Panel (b): fluorescent images of HT-29 human colon carcinoma cells grown as spheroids for 72 h and then exposed to varied concentrations of topotecan plus 1 uM of the ATR inhibitor VE-821 over a time course from 6 to 72 h. At the selected time points, cells were exposed to calcein AM and ethidium homodimer (live/dead stain; Invitrogen). Live cells take up calcein AM which fluoresces green in the presence of calcium. Ethidium homodimer cannot penetrate intact cell membranes and fluoresces red when bound to cell-free DNA indicating dead cells. At increasing topotecan concentrations and with increasing time, there is increased killing of the HT-29 cells by topotecan. Panel (c): Cell Titer-Glo 3D was used to assess cell killing by topotecan plus 1 uM ATR inhibitor VE-821 after 72 h exposure to the combination
However, while many of the NCI-60 cell lines form xenograft tumors in immune-deficient mice, 60 human cell lines are not sufficient to represent the heterogeneity of human malignant disease. Consequently, to better replicate clinical disease, there has been a great effort devoted to using materials recently derived from patients’ tumors in experimental models to identify optimal therapeutic regimens. Biopsy samples from a primary tumor, metastatic disease, or circulating tumor cells from a patient can be implanted into NSG severely immune-deficient mice and propagate as patient-derived xenograft (PDX) tumor nodules [69–74]. PDX tumors are composed of a patient’s cancer cells and, thus, have the genetic abnormalities that define and drive the patient’s tumor. By examining the response of a wide array of PDX models to FDA-approved and investigational agents, the sensitivity of each tumor to specific therapeutic agents, alone or in combinations, can be determined [98–101].
Development and Propagation of PD Cell Lines
PDX tumor specimens are routinely implanted subcutaneously in the flank of NSG mice or orthotopically in a mouse organ corresponding to the tissue of origin of the tumor [102]. Orthotopic transplants may better mimic the genotypic and histological characteristics from the tumor [103].
The usefulness of human tumor xenografts as a source of cells for cell-based screening in the cloning assays has been explored. This strategy offers the opportunity to correlate gene expression profiles within a tumor with sensitivity to therapeutic agents. The application of the tumor clonogenic assay (TCA) to chemosensitivity testing of clinical tumors and xenografts and for assessments within drug discovery was examined [104, 105]. Comparison between the responses of human tumors (well established as xenografts in nude mice) in the tumor clonogenic assay in vitro to that of the clinical response in mice indicated that 62% of the comparisons for drug sensitivity and 92% of the comparisons for drug resistance were correct. The same percentage of true/false observations was found when tumors were tested in the tumor clonogenic assay in vitro after serial passage in nude mice and their response was compared to in vivo activity in corresponding xenografts (60% and 90%, respectively). Furthermore, PDX responses to chemotherapeutic agents have been suggested to resemble the response rates of mono-therapy in clinical trials [69–74, 103], making cells derived from them a potential model of interest for use in high-throughput screening assays.
Cell-Based Screens Using PD Cells
While patient-derived xenografts (PDX) implanted into severely immune-deficient mice (NSG, NOD SCID, SCID, or nude) may be of value in identifying efficacious agents for treatment of specific tumor types, the cost in time, and money, and the complexity of performing these tests has resulted in an effort to generate cell-based patient-derived models. Cell-based models have the advantage of being amenable to automation, thus allowing increased throughput at reduced costs and with an improvement in time to result. To facilitate development of an immortal cell line, the Rock-II kinase inhibitor, Y27632, is sometimes included to chemically produce a mutant RAS-like cell metabolic state [106]. There is a distinction between patient-derived cell lines which are cancer cells adapted to growth in cell culture and organoid cultures which are minceates of patient tumor tissue dissected to remove fatty and necrotic tissue, treated to remove red blood cells, then prepared as a heterogeneous mixture of small clusters of cells which can grow in short-term culture [107]. Generating organoid models can occur in a time frame of several weeks, while development of cancer cell lines and the generation of patient-derived xenografts usually require more time. The organoid model could potentially facilitate sampling of patient populations that had previously been difficult to model using traditional approaches and may allow identification of therapeutic strategies for specific patients. The development of organoid culture methods from human tumors is one avenue that may provide robust, stage-specific, cellular models that will be a valuable resource for the field [108]. Another approach is the use of PDX tumor-bearing mice in a screening mode.
Over the course of several years, Gao et al. utilized ~1000 PDX models exhibiting a wide variety of driver mutations to explore several compounds with potential anticancer activity [109]. When the RECIST criteria and the response categories (complete response, partial response, stable disease) were combined into a single “responder” category, the response calls made on a single mouse were consistent with the majority response 95% of the time, which strongly supported the rationale of using one animal to reflect the true response. Thus, a 1 × 1 × 1 experimental approach was used, facilitating efficient assessment of compound response of the 1000 xenografts to determine population-based response rates. Thirty-eight unique small molecules were screened either as single agents [38] or in combination [26], and model responses were categorized. Associations between PDX genotype and compound response were observed. The data confirmed earlier work that PDX models may be useful in selecting compounds with clinical potential.
Stromal cells play an important role in some cancer types through paracrine signaling and may regulate a tumor’s response to drug treatment [89, 110, 111]. Furthermore, stromal cells can contribute biomarkers that may be predictive of treatment regimen and/or response to treatment [112]. Lung cancer PDX and prostate cancer PDX have been applied in cell-based assays after transfer of tumor cells to culture. Lung cancer cells mixed with fibroblasts from lung cancer surgical specimens were embedded in Cultrex basement membrane extract as a 3D cell-based screen model, and prostate cancer cells mixed with human osteoblasts were embedded in a hydro-gel as a 3D cell-based screen model [113, 114]. The 3D hydro-gel system used to co-culture prostate cancer cells with osteoblast cells mimicked the prostate cancer cell-osteoblast in the bone metastatic microenvironment. The cancer cells and fibroblasts were embedded in the matrix which allowed paracrine signaling between the cells. Furthermore, this 3D model allowed culture of prostate cancer cells that tend to be difficult to grow as mono-layers. When dovitinib, a receptor tyrosine kinase inhibitor of FGFR and VEGFR, was tested in the 3D prostate cancer-osteoblast model, it exhibited activity when prostate cancer cells and osteoblast cells were co-cultured and with either cell type alone [114].
Related posts:
 Cervical Cancer PDOX Models
The Revival of Patient-Derived Xenograft Mouse Models of Cancer: Way Back to the Future
Use of Patient-Derived Orthotopic Xenografts (PDOX) to Evaluate Transformative Cancer Therapeutics
Why Patient-Derived Mouse Models Need to Be Orthotopic
Cervical Cancer PDOX Models
The Revival of Patient-Derived Xenograft Mouse Models of Cancer: Way Back to the Future
Use of Patient-Derived Orthotopic Xenografts (PDOX) to Evaluate Transformative Cancer Therapeutics
Why Patient-Derived Mouse Models Need to Be Orthotopic
 The Use of Pediatric Patient-Derived Xenografts for Identifying Novel Agents and Combinations
 Development of Orthotopic and Spontaneous Metastatic Human Tumor Xenograft Models for Experimental Therapeutics
Stay updated, free articles. Join our Telegram channel

Full access? Get Clinical Tree


