Controversies Related to Oncology Clinical Trial Development
University of Washington and Fred Hutchinson Cancer Research Center, Seattle, WA, USA
1. Is the “3 + 3” design the best means to determine dose for phase II?
In my opinion, the answer is “no.” The 3 + 3 design is the most common method used in phase I studies to determine dose for subsequent trials. If none of the first three patients treated at a given dose have dose-limiting toxicity (DLT), the next three receive the next higher dose, while if two or three of the first three have DLT the next three are treated at a lower dose. If DLT occurs in one of the initial three, the next three receive the same dose, and that dose is used subsequently if DLT is seen in one of the six, with the dose considered too high if DLT occurs in 2–4 of these six.
The 3 + 3 design has the advantage of simplicity. However, fundamental to any statistical design are its “operating characteristics” (OCs). OC refers to how a design performs under various clinical scenarios. For example, by declaring that a DLT frequency of 16% (1/6) is “acceptable” but a frequency of 33% (2/6) is not, we may infer that an acceptable DLT rate is 25–30%. Now let us assume that a new drug has a true DLT rate of 50%. Application of the binomial theorem indicates that in this scenario, the probability that two or three of the first three patients will have DLT is 50%. Thus, there is a 50% chance that the next cohort of patients will be treated at an even higher dose. Even if the true DLT rate is 70%, this probability is 21%. This simple example suggests that the 3 + 3 does not have good OC.
A preferable alternative is the “continuous reassessment method” (CRM). The CRM is a Bayesian design. Thus, it begins with a prior probability of DLT at each of several doses such that the higher the dose, the higher the prior probability. As patients are treated, Bayes theorem is used to incorporate the DLT data with the prior probability to derive a posterior (or current) probability of toxicity for each dose. The next cohort of patients is treated at the dose associated with a posterior probability of DLT closest to 25–30%. A feature of the CRM is that a dose found to be “too toxic” can subsequently be found to be acceptable if new patients have no or very little toxicity. This is known as “Bayesian learning.” It should be contrasted with the 3 + 3, in which the dose for the next cohort is determined solely by the data from the most recent cohort regardless of what occurred on cohorts prior to the most recent. Because it thus makes use of more information than the 3 + 3, it is intuitive that the CRM will have better OC than the 3 + 3 and this has been demonstrated many times.
Although the CRM is superior to the 3 + 3, both methods suffer from the assumption that toxicity is solely a function of dose. Intuition suggests that this is not the case, as, everything else being equal, a 70-year-old might be expected to have more toxicity at a given dose than a 40-year-old. And it seems paradoxical to recognize the effect of covariates (“prognostic factors” in phase II (efficacy) trials but not in phase I trials). Rogatko et al. (2004) have shown that, among patients eligible for phase I trials, performance status, weight loss, tobacco use, alkaline phosphatase level, and other criteria are as important as dose in forecasting toxicity. Since it makes decisions based on only 3–6 patients, the 3 + 3 is particularly susceptible to confounding an effect of dose on DLT with an effect of, for example, patient age. In fact, there may not be one dose for all patients, but different doses may be appropriate in different patients. Publications have appeared allowing the analysis of effects of covariates in phase I studies.
Typically, DLT is defined based on the occurrence of grade 3–4 toxicity. While the criteria for grade 3–4 toxicity are straightforward with symptomatic toxicity, this may not be the case with asymptomatic toxicities such as elevations in liver enzymes or creatinine. Thus, at least in acute myeloid leukemia (AML), the relation between grade 3–4 asymptomatic toxicity and death, which presumably an event dose reduction is intended to prevent, is not at all clear. Recognizing that such relations may reflect associations rather than causation, a more empirically based system to replace the somewhat arbitrarily defined criteria for grade 3–4 asymptomatic toxicities seems warranted.
Finally, it is now becoming clear that the maximum tolerated dose (MTD) may be higher than the optimum biologic dose (OBD). This calls into question the presumption of a direct relation between higher dose, increased efficacy, and increased toxicity that underlies many phase I designs. One means to test the hypothesis that the OBD rather than the MTD is the dose of interest for many “targeted” therapies would involve, over many targeted therapies, the randomization of patients between these doses with the aim of seeing which dose produced a higher response rate, was associated with longer survival, and so on.
2. Is the Simon phase II design the best phase II design?
Again, I believe the answer is “no.” Just as the 3 + 3 is the standard phase I design, the Simon two-stage is the standard phase II design. Here the investigator specifies a rate of “no interest” (called p0), often the historical efficacy rate; a rate “of interest” (p1), typically the anticipated efficacy rate with the new treatment; and acceptable rates of false positivity and false negativity (typically, 10% for each). The design then specifies how many patients would be treated in a first stage and how many of these must respond before subsequent patients are entered into a second stage. The design also notes how many are to be entered into the second stage and how many responses must be seen in all patients for the drug to be called a “success” (i.e., that it has achieved its target efficacy rate, with the specified false-positive rate).
A problem with the design was noted by Thall and Simon (2008). Specifically, it assumes that p0 is a constant rather than a statistic. That is, it assumes p0 is based on treatment of an infinite number of patients when in fact it may be based on relatively few patients. The smaller the number of historical control patients, the greater the false-positive and false-negative rates are increased relative to their nominal values and should be adjusted as noted by Thall and Simon (2008).
Much as the 3 + 3, the Simon two-stage ignores patient heterogeneity. We will use a trial of a new agent for relapsed AML as an example. The average historical complete response (CR) rate with standard therapy is about 15%, and so this might be taken as p0. However, the CR rate depends heavily on the duration of first CR and number of prior therapies the patient has received. Depending on these covariates, the CR rate ranges from 60% (for patients with first CR durations >1 year who are receiving the new drug(s) as initial therapy for relapse) to <1% for patients with first CR duration <6 months who have received several prior therapies for relapse. Given the relatively small number of patients often entered in the first stage of the design, it is quite plausible that the result might be falsely negative if most patients entered in this stage are in the <1% group and falsely positive if many patients entering the first stage are in the 60% group. One possible solution is separate trials in each prognostic subgroup. However, this does permit use of data from one trial to adaptively affect conduct of the others. Rather than ignoring heterogeneity or conducting separate trials Wathan, Thall, and Estey (2008) proposed a Bayesian design that considers subgroup treatment interactions (STIs) and uses the incoming data to assess the extent to which the results from the subgroups can be combined. Consider a Simon two-stage design in which p0 is 0.21 and p1 for the new therapy is 0.21 + 0.18 = 0.39. With false-negative and false-positive rates each at 0.10, the design calls for entering 22 patients in a first stage and proceeding to a second stage if more than four CRs are observed; the second stage would enroll an additional 21 patients, and the new therapy accepted as successful if the CR rate was >12/43. We will contrast this design with the STI design parameterized to also enter 22 patients in a first stage with false-negative rate 0.1. The STI assumes there are two subgroups, the first (patients with a long CR) with a historical CR rate of 0.43 and the second (patients with a short CR) with a historical CR rate of 0.11; given the number of patients in the two groups, the overall historical CR rate (p0) is 0.21, as in the two-stage Simon design. Table 130.1 compares the probability of rejecting the new treatment and the mean number of patients treated using the Simon two-stage design (S2S) and the STI.
Table 130.1 Scenarios comparing the probability of rejecting new treatment and the mean number of patients treated using the Simon two-stage design (S2S) and the subgroup treatment interaction (STI).
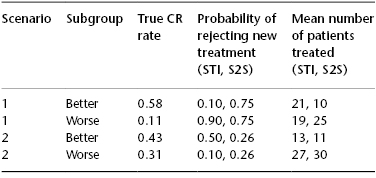
In scenario 1, the new therapy is truly an advance in the better, but not the worse, group, while in scenario 2 the opposite applies. Because it does not recognize heterogeneity, the S2S has the same probability of rejecting the new treatment independent of subgroup. In contrast, the STI has better OC, and in particular is much less likely to (mistakenly) reject the new treatment in the better group in scenario 1 and in the worse group in scenario 2 and more likely to (correctly) reject the new treatment in the worse group in scenario 1 and in the better group in scenario 2. Furthermore, and desirably, a greater proportion of patients treated with the STI than the S2S belong to the better group in scenario 1 and to the worse group in scenario 2. Further simulation studies indicate that this type of adaptation would not be possible if separate trials were done.
Perhaps the biggest weakness of the Simon two-stage design is its single-arm nature. This delays comparison of a new therapy with a standard therapy (or another new therapy) until phase III. Although in principle multivariate analysis could be performed to assess whether, after accounting for covariates, the new therapy is best, such an analysis can only account for known covariates. Randomization is needed to account for unknown covariates. It seems paradoxical that randomization is a fundamental part of phase III trials but not of the phase II trial that determines whether the phase III trial will be undertaken. This has led several authors to propose the use of randomized phase II trials whose intent is to select the best therapy to take into a larger trial. These trials are often criticized as “underpowered.” And, indeed, consequent to their small sample sizes relative to phase III trials, their ability to detect differences should they exist (“power”) is frequently only 50–60% of the time, contrasted with the 80% common to many large phase III trials. However, this 80% power is only nominal. Consider a case where there are four candidate new therapies to compare versus a standard in a phase III trial. As is often the case, preclinical rationale is insufficient to know which of the four to select. It follows that, in the absence of clinical data, the chance of selecting the best of the four is only 25%. Thus, the phase III trial has a power of 80% only if the process by which the new therapy was selected is ignored. If it is not ignored, the power is 25% × 80% = 20%, and it is the latter figure that the 50–60% power of the selection design competes against. Simply put, the worse false-negative may result from not investigating a new therapy at all, and it is this possibility that has spurred interest in randomized phase II selection designs, which are now routinely used in AML trials of the National Cancer Research Institute (Medical Research Council) in the United Kingdom.
3. Does the standard phase III design serve us well?


