This chapter summarizes mechanisms and phenotypes behind the multifaceted negative effects of impaired glucose control on microvascular and macrovascular complications of diabetes.
1
Introduction
Diabetes mellitus (DM) is a worldwide health issue with the potential for significant negative health outcomes. The prevalence of DM is expected to rise from 9.1% of the general population in 2014 to 17.9% in 2060 [ ]. Patients with DM have a twofold increased risk for cardiovascular disease (CVD) and 1.6-fold increased cardiovascular mortality compared with nondiabetic individuals [ ]. The reduced overall survival of patients with DM mostly depends on the development of diabetes-related microvascular and macrovascular complications, these latter including coronary artery disease (CAD), peripheral vascular disease, and cerebrovascular disease. Diabetes-related complications (DRCs) claim the greatest burden in subjects with diabetes also in terms of morbidity and impaired quality of life [ ]. For example, diabetic kidney disease (DKD) is the leading cause of end-stage kidney disease worldwide (ESKD), with an estimated prevalence of 30% in type 1 diabetes (T1D) and 50% in type 2 diabetes (T2D) [ ], while diabetic retinopathy (DR) is the main cause of blindness in the working-age population in developed countries [ ].
In the last decades, several randomized clinical trials (RTCs) and observational studies clarified the role of intensive glycemic control in the prevention of DRCs and associated mortality [ ], which is influenced by exposure to hyperglycemia and possibly iatrogenic hypoglycemia. It is less clear whether glycemic variability or a more stringent glycemic control in the earliest phase of the disease have a role in DRC-related negative outcomes.
2
Glucotoxicity
Since DRCs were firstly described, clinicians and researchers tried to point out their physiopathological features and to identify potential therapeutical strategies able to reduce incidence, progression, and burden of these complications.
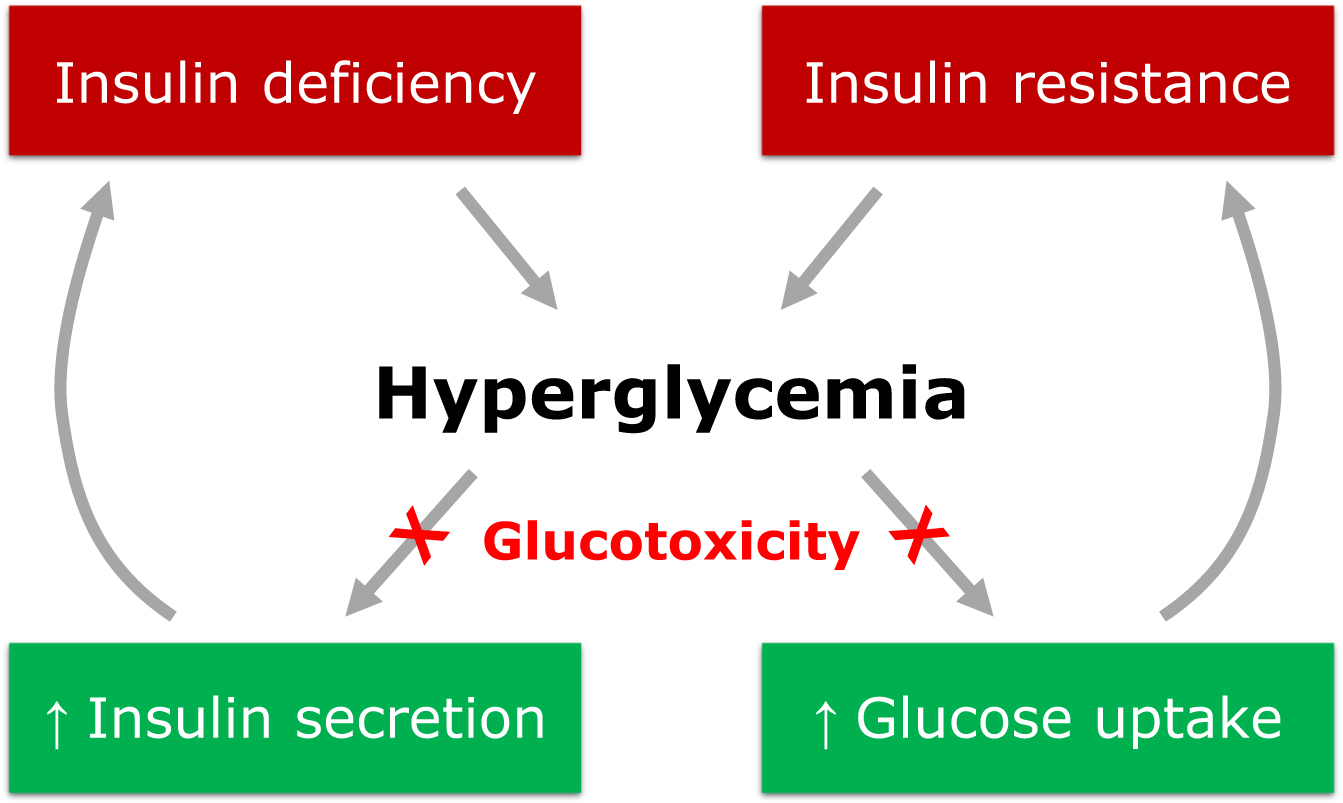
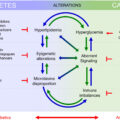
Chronic exposure to hyperglycemia was firstly proposed as a major driver of DRCs. Indeed, sustained hyperglycemia is a key mediator in the organ injury that leads to the development of DRCs via a complex series of mechanisms named glucotoxicity. Glucotoxicity refers to the damage occurring in both pancreatic β cells and peripheral tissues, leading to the disruption of physiological cellular mechanisms affected by carbohydrate metabolism ( Fig. 16.1 ).
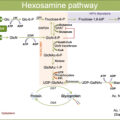
The main metabolic pathways involved in the vascular insult at the basis of DRCs are production of advanced glycation end products (AGEs), activation of protein kinase C (PKC), activation of the polyol pathway, increased oxidative stress, and activation of the hexosamine pathway [ ]. Through the activation of these pathways, glucotoxicity promotes the progression of vascular damage and atherosclerosis of both micro- and macrovascular districts. Glucotoxicity usually acts in synergy with other cardiovascular risk factors, like hypertension, dyslipidemia, obesity, and tobacco smoking, which usually co-exist in patients with DM and can potentiate vascular-specific detrimental effects of hyperglycemia.
The association of chronic hyperglycemia and DRCs has been widely demonstrated by numerous clinical and in vitro studies describing potential pathogenetic links between supraphysiological plasma glucose levels and vascular damage [ ]. However, clinical trials investigating whether intensive glycemic control could reduce the incidence and severity of DRCs reported inconsistent results. Robust evidence from UKPDS, ACCORD, ADVANCE, and VADT studies showed a strong correlation between intensive glycemic control and reduced incidence of microvascular complications, but a neutral or even negative effect on CAD, peripheral vascular disease, cerebrovascular disease, and on the overall survival of patients [ ], highlighting potential harms when intensive glycemic control is obtained with drugs that may induce hypoglycemia. In fact, a U-shape pattern exists in the relation between glucose control and incidence of macrovascular complications that require medical intervention, as observed in ACCORD’s intensive treatment arm [ ] and other studies [ , ]. Furthermore, the average glucose levels indicated by the glycated hemoglobin (HbA 1c ) only partially explain the increased risk for micro- and especially macrovascular complications conferred by DM, as it is commonly experienced that two patients with similar HbA 1c and demographic characteristics may have a quite different burden of both micro- and macrovascular DRCs [ , ]. Thus, although glycemic control assessed by HbA 1c remains a cornerstone in the management of diabetic patients, other parameters are needed to better define glycemic control and refine risk stratification for DRCs and long-term outcomes.
Although the HbA 1c provides a simple and inexpensive method to monitor treatment efficacy, other metrics are emerging (or resurfacing) in the evaluation of daily and long-term fluctuation in plasma glucose levels for the surveillance of DRCs, also thanks to the widespread application of novel technologies to diabetes ( Table 16.1 ). Continuous glucose monitoring (CGM) systems, often connected to smartphones or wearable accessories, offer the opportunity to monitor glycemic control in the real life setting for prolonged periods with a high time resolution. Interactive and smart systems to monitor plasma glucose levels improve the self-management of treatments in patients and are more informative for physicians, who may thus have an accurate picture of the within-day, between-day, and long-term glycemic trajectories. This growing amount of available data renews the interest in glycemic variability (GV) for its potential role in the development and progression of DRCs.
| Methods | Description |
|---|---|
| Blood test | Laboratory measurements of blood glucose or HbA 1c in venous blood samples |
| SMBG | Repeated self-measurements of capillary blood glucose levels obtained by fingerstick using a handheld glucometer |
| CGM | Interstitial glucose measurements automatically performed by a small sensor attached to the skin, typically on the abdomen or arm that sends the data wirelessly to a monitoring device, such as a smartphone or dedicated receiver. These systems track glucose levels throughout the day and night and can provide real time data and predictive alerts on the speed and direction of glucose variations |
| FGM | Intermittent interstitial glucose measurements automatically performed by a small sensor attached to the skin, typically on the abdomen or arm, that sends the data after manual scanning to a monitoring device, such as a smartphone or dedicated receiver. These systems track glucose levels throughout the day and night and can provide real time data on the speed and direction of glucose changes |
3
Glycemic variability
GV refers to the measurement of physiological or pathological fluctuations in plasma glucose levels within a given time interval. Nowadays, there are numerous metrics available to describe GV that can be summarized in two main categories: long-term and short-term GV metrics. Coefficient of variation (CV) and standard deviation (SD) are the most used metrics for long-term GV, which is usually based on visit-to-visit measurements of fasting plasma glucose and HbA 1c . Mean of daily differences (MODD), calculated as the absolute differences between two glucose values measured within an interval of 24 h, was considered the best metric for between-day GV, but it is being gradually replaced by more accurate CGM-derived metrics, including mean amplitude of glycemic excursions (MAGE) and mean blood glucose (MBG) [ ]. Short-term GV provides much greater time resolution, allowing the quantification of rapid upward and downward glucose changes that physiologically occur minute by minute. At present, the most used metric to assess daily GV is the time in range (TIR), which is the percentage of time spent within a target glucose range each day.
4
Glycemic variability and complications of diabetes
GV has emerged as a powerful predictor of DRCs. Among long-term GV measures, HbA 1 c variability was strongly associated with micro- and macrovascular complications and mortality in both T1D and T2D. The DCCT showed that increased HbA 1 c variability is more accurate than mean HbA 1 c in the prediction of microvascular complications. In particular, a post-hoc analysis of this study revealed that a 1% increase in HbA 1 c SD results in an 80% increase in nephropathy risk and a doubled retinopathy risk in T1D patients [ ]. Accordingly, the Finnish Diabetic Nephropathy Study Group demonstrated that HbA 1 c variability, measured as HbA 1 c CV or SD, is a strong predictor of microalbuminuria, overt nephropathy, and CVD events in T1D patients [ ]. GV measured by HbA 1c SD or CV showed a similar predicting power in T2D patients. In a prospective cohort of 8439 patients, higher HbA 1c SD was associated with a higher risk of chronic kidney disease (CKD) and CVD [ ]. In the RIACE study, Penno et al. observed that HbA 1c variability had a better performance than the average HbA 1c in predicting albuminuric CKD—but not diabetic retinopathy—in a large cohort of T2D patients [ ]. In a post-hoc analysis of the ADVANCE study, HbA 1c CV, and SD predicted macrovascular and combined macro- and microvascular events in T2D patients but not isolated microvascular events [ ].
It has been proposed that repeated or large glucose swings may contribute to diabetes-related complications, unrelated to HbA 1c degree. Short-term fluctuations in plasma glucose level, which can led to micro- and macrovascular damage, are not adequately reflected by single or repeated HbA 1c measurements [ ], so that the assessment of short-term GV may offer a better option to evaluate DRC risk [ , ]. In T1D patients, however, the predictive value of short-term GV is supported by conflicting findings. Lachin et al. reported a possible relationship of kidney and eye disease with MBG, calculated as the area under the curve of 7-point self-monitoring blood glucose (SMBG) [ ]. In post hoc analyses of the DCCT, mean HbA 1c but not MAGE was also associated with nephropathy and retinopathy [ ], MBG was associated with retinopathy only [ ], while both MBG or MAGE predicted diabetic neuropathy [ ]. Concerning macrovascular complications, a significant association was observed between macrovascular events and MBG but not daily glucose SD [ ]. This observation was partially confirmed by Snell-Bergeon et al., showing an independent correlation between CGM-derived measures of GV and coronary artery calcification only in male patients [ ]. In T2D patients, findings from several studies support the hypothesis that increased short-term GV plays a key role in the development of microvascular complications, while the relationship with macrovascular complications is less clear. MAGE, glucose SD, or daily GV were associated with a higher risk for the development and progression of diabetic retinopathy and nephropathy [ ]. MAGE was also proposed as an independent predictor of CAD [ , ] or subclinical atherosclerosis measured by carotid intima-media thickness (IMT) [ ]. Barbieri et al. observed a reduction in IMT after a better control of daily glucose fluctuations obtained with DPP-4 inhibitors [ ]. However, in the HEART2D study, there was no correlation between lower daily GV and cardiovascular outcomes [ ]. Postprandial hyperglycemia, better than other forms of glycemic variability, has been reported as a predictor of cardiovascular risk: in patients with HbA 1C levels <7.5%–8%, postprandial peaks of glucose are the main contributors to glycemic variability and total exposure to hyperglycemia, and they seem to activate oxidative stress more than sustained (but stable) hyperglycemia in T2D [ ].
5
Glycemic legacy
In complex chronic diseases, the legacy effect describes the long-term benefits of intensive control of risk factors prior to or immediately after the diagnosis of the disease. As such, the legacy effect in DM, also known as metabolic memory or glycemic legacy (GL), usually refers to the long-term consequences of early glycemic control on the risk of DRCs and mortality, regardless of the subsequent management of the disease.
The mechanisms underlying the metabolic memory at the basis of the legacy effect in DM are not completely understood. One important consequence of the cellular impact of hyperglycemia seems to involve epigenetics. Hyperglycemia, together with aging and fat intake, is considered a major epigenetic risk factor. Elevated blood glucose leads to epigenetic modifications of the endothelium through histone modification, DNA methylation, and dysregulation of noncoding RNAs [ ]. These epigenetic changes triggered during early periods of hyperglycemic exposure and uncontrolled diabetes are not immediately corrected, even after restoration of normoglycemia and metabolic balance. They initially involve the endothelium, driving changes in the microvasculature and promoting the development of microvascular and macrovascular complications [ , ].
Understanding specific CVD pathologies associated with diabetes and their possible link to epigenetics will be of far-reaching significance, although further studies in this field are mandatory to advance personalized therapeutic interventions and individualized risk assessment in subjects with diabetes. An early glycemic control is supposed to limit the epigenetic effects of chronic exposure to hyperglycemia of the metabolic memory, leading to a legacy effect on the control of DRCs and cardiovascular risk.
6
Glycemic legacy and complications of diabetes
The first evidence of a legacy effect in DM derive from the EDIC study (in T1D) and UKPDS in (T2D), showing longstanding cardiovascular benefits years after the randomization in patients in whom a strict glycemic control was achieved early during the intervention [ , ]. Thereafter, Lind et al. confirmed a long-term reduction in DRCs in the same UKPDS patients even after 20 years from randomization [ ]. Evidence from the ADVANCE trial shows a significant reduction in microvascular complications, especially kidney disease, in patients who underwent intensive treatment to achieve a strict glycemic control [ ]. Similar evidence was observed for diabetic retinopathy in the ACCORD Eye study, a post-hoc analysis of the ACCORD trial [ ].
The role of GL was further investigated in several observational studies in real world populations. In 34,737 patients followed up for 13 years, HbA 1c levels greater than 6.5% during the first year after diagnosis increased by 20% the risk of future microvascular (i.e., ESKD, diabetic eye disease, and lower-extremity amputation) and macrovascular events (i.e., cerebrovascular disease, heart disease, heart failure, and vascular disease), even when HbA 1c trajectories were corrected after the first year [ ]. Another longitudinal study examining the same dataset found a 27% higher mortality rate and 28% higher rate for microvascular DRCs, but not macrovascular events, in patients whose HbA 1c was initially high and later decreased, when compared with those with stable and low HbA 1c levels [ ]. Similar findings were observed in a real-word study with a longer follow up period, which suggests that the beneficial GL effect on retinopathy, DKD, and CVD could last for at least 15–20 years [ ].
Interestingly, the link between GL and complications was observed also in obese patients who achieved T2D remission after bariatric surgery. Among 4863 patients who underwent bariatric surgery, those who experienced T2D remission showed a 29% lower risk of incident microvascular complications. Moreover, the risk for incident microvascular disease was inversely proportional to the time spent in remission in those who experienced a relapse, supporting a legacy effect of bariatric surgery that may be mediated by a prompt normalization of glycemic control [ ].
7
Conclusions
Within-day and between-day excursions of plasma glucose level play a crucial role in the progression of microvascular DRCs, while the role of GV in macrovascular DRCs is not completely clarified. The implementation of newer CGM-derived metrics, which are less prone to errors and bias compared with traditional SMBG-based metrics, and the standardization of the metrics across different studies should provide a better understanding of the complex pathogenetic link between GV and DRCs. The studies that used CGM-derived metrics achieved consistent results [ , , ], supporting the positive role of a reduced long-term and short-term GV on DRCs, which should become a cornerstone of an appropriate diabetes management. Additionally, special attention should be given to achieve a strict glycemic control in the earliest phase of the disease because an intensive treatment shortly after diagnosis can lead to better long-term outcomes in patients with DM, regardless of future glucose trajectory.
Dedicated studies properly focused on the role of GV and/or GL on the development and progression of micro- and macrovascular DRCs are still lacking, and most available evidence derives from post hoc analyses of studies designed to investigate different outcomes. This observation may explain a certain degree of heterogeneity between different study protocols, metrics, and results. Moreover, future studies should account for the increasing availability of novel classes of antidiabetic drugs that allow for a stricter glycemic control with minimal risk for hypoglycemia and, more importantly, that proved effective against DRCs independently of their glucose lowering actions, including GLP1 agonists and SGLT2 inhibitors. Although RCTs and retrospective studies with these therapies demonstrated clear benefits in the short term, whether their use to reduce GV has a long-term impact or show a legacy effect should be further investigated.
References
Related posts:
 Overview on chronic complications of diabetes mellitus
 Molecular mechanisms involved in hyperglycemia-induced cellular damage
 Diabetic retinopathy: New insights
 Diabetic neuropathy: Current issues in diagnosis and prevention
 Diabetes-related cognitive impairment and dementia
 Cancer in diabetes: Who is who?
Stay updated, free articles. Join our Telegram channel

Full access? Get Clinical Tree


