1
Definitions
Nonalcoholic fatty liver disease (NAFLD) is defined by the presence of hepatic steatosis by imaging or histology, in the absence of secondary causes of hepatic fat accumulation [ , ]. By definition, it is considered hepatic steatosis when liver fat accumulation is ≥5% by histology or magnetic resonance imaging proton density fat fraction (MRI-PDFF) or ≥5.6% by proton magnetic resonance spectroscopy ( 1 H-MRS) [ ]. Secondary causes that must be ruled out for the diagnosis of NAFLD include alcohol consumption (≥30 gr for men and ≥20 gr for women daily), viral hepatitis, steatogenic drugs (e.g., amiodarone, estrogen, methotrexate, corticosteroids), hemochromatosis, autoimmune hepatitis, alpha-1 antitrypsin deficiency, Wilson’s disease, etc.
Nonalcoholic fatty liver disease encompasses a wide range of liver conditions that go from isolated hepatic steatosis (also known as nonalcoholic fatty liver [NAFL]) to nonalcoholic steatohepatitis (NASH) or NASH-related cirrhosis [ , ]. Isolated steatosis is characterized by intrahepatic fat accumulation in the absence of significant inflammation and hepatocellular injury (i.e., hepatocyte ballooning). If there is simultaneous presence of steatosis, inflammation, and hepatocyte ballooning, it is considered definite NASH, irrespective of the presence or absence of liver fibrosis [ , ].
However, it was recently called into question whether the term and definition of NAFLD were appropriate [ , ]. Among the main issues raised by a panel of experts was the fact that the term “nonalcoholic” was not representative of the pathophysiology of NAFLD and overlooked the strong link between NAFLD and metabolic dysfunction. Moreover, since its first description in 1980 [ ], the definition of NAFLD has always been based on the exclusion of other entities. Therefore, it was proposed that a new “positive” definition was needed, which would allow to define this entity independently of the alcohol consumption and/or the presence of other liver conditions. This is important, as there has been extensive evidence that the coexistence of obesity and/or metabolic syndrome with other chronic liver conditions (such as viral hepatitis or alpha-1 antitrypsin deficiency), results in worse liver histology and outcomes [ , ]. This suggests that NAFLD may coexist with other liver entities and affect its progression and response to treatment.
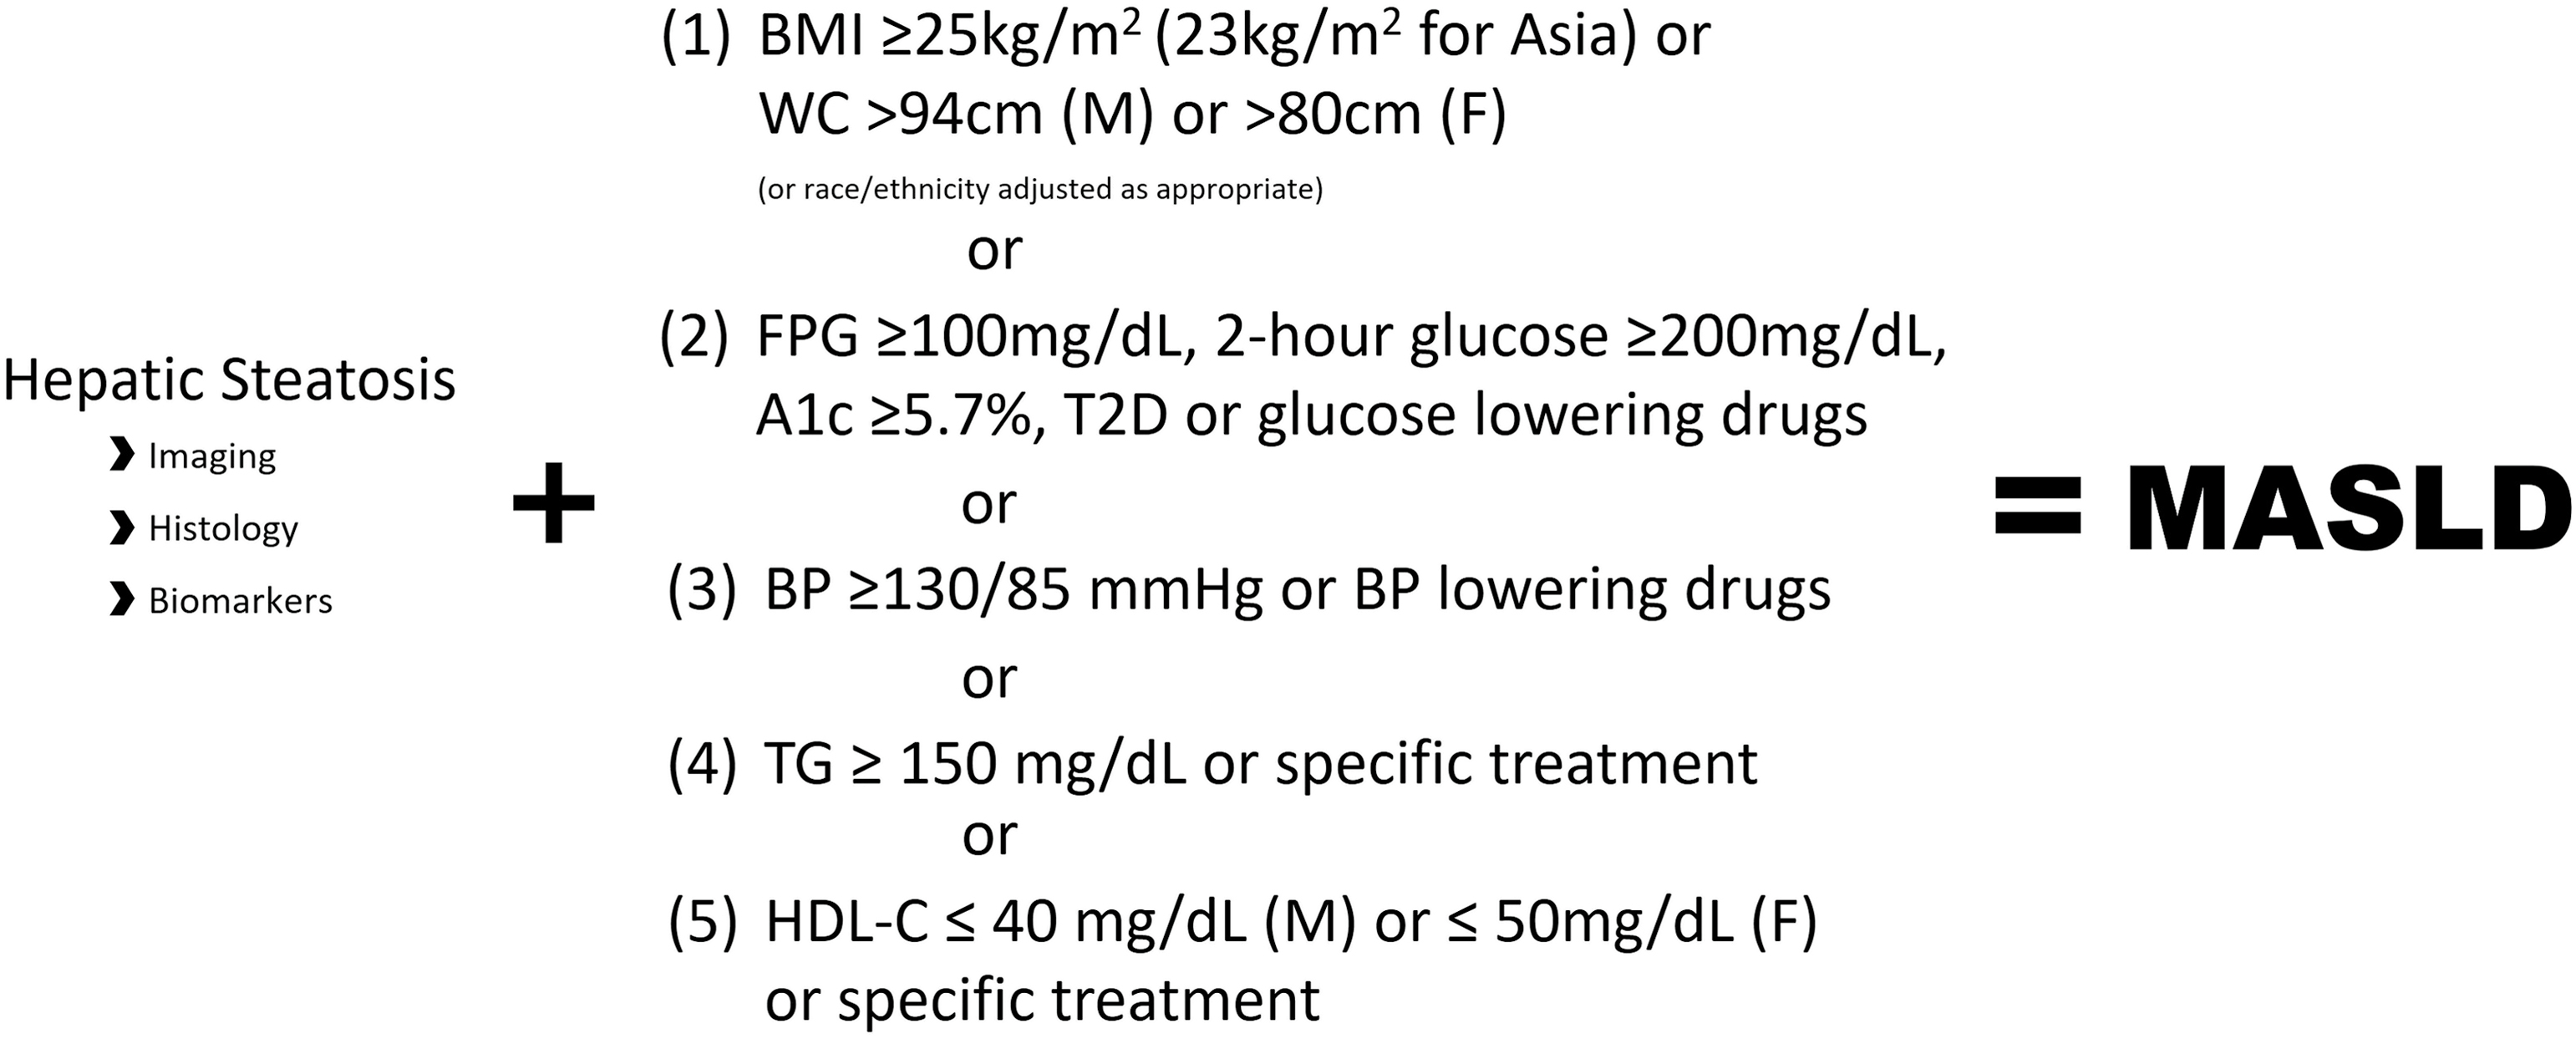
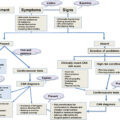
Therefore, the term NAFLD has been updated to metabolic (dysfunction)-associated steatotic liver disease (MASLD) [ ]. Metabolic (dysfunction)-associated steatotic liver disease is defined as hepatic steatosis detected by any means (i.e., imaging, biopsy, or biomarkers) in the presence of (a) overweight/obesity or increased waist circumference, (b) abnormal glucose metabolism or type 2 diabetes (T2D), (c) elevated blood pressure or use of medication, (d) elevated triglyceride levels or use of lipid-lowering medication, or (e) low HDL or use of lipid-lowering medication [ ]. Speficic criteria for the definition of MASLD can be found in Fig. 12.1 .
For the purpose of this chapter, we will use the terms of NAFLD and MASLD interchangeably, except when specifically stated. Due to the novelty of the new definition, most of our current knowledge of MASLD comes from extrapolation from what we learned in NAFLD.
2
Epidemiology
Secondary to the obesity epidemic, NAFLD has become the most common chronic liver disease worldwide. The estimated prevalence of NAFLD varies depending on the diagnostic tool used, as well as on the characteristics and geography of the population. After adjustments for these variations, a meta-analysis of 86 studies from 22 countries ( n = 8,515,431) estimated that the global prevalence of NAFLD was ∼25% [ ]. In the same study, it was estimated that 59% of NAFLD patients had biopsy-proven NASH [ ]. However, the true prevalence of NASH in the general population is likely to be significantly lower, due to an inherent selection bias among patients undergoing liver biopsies (i.e., sicker patients are more frequently referred for a liver biopsy). A more accurate estimate likely ranges between 20% and 30% of patients with NAFLD [ , ]. In turn, patients with NASH are at higher risk of developing liver fibrosis and other liver-related complications [ ], with an estimated incidence of advanced fibrosis of 68 in 1000 person-years [ ].
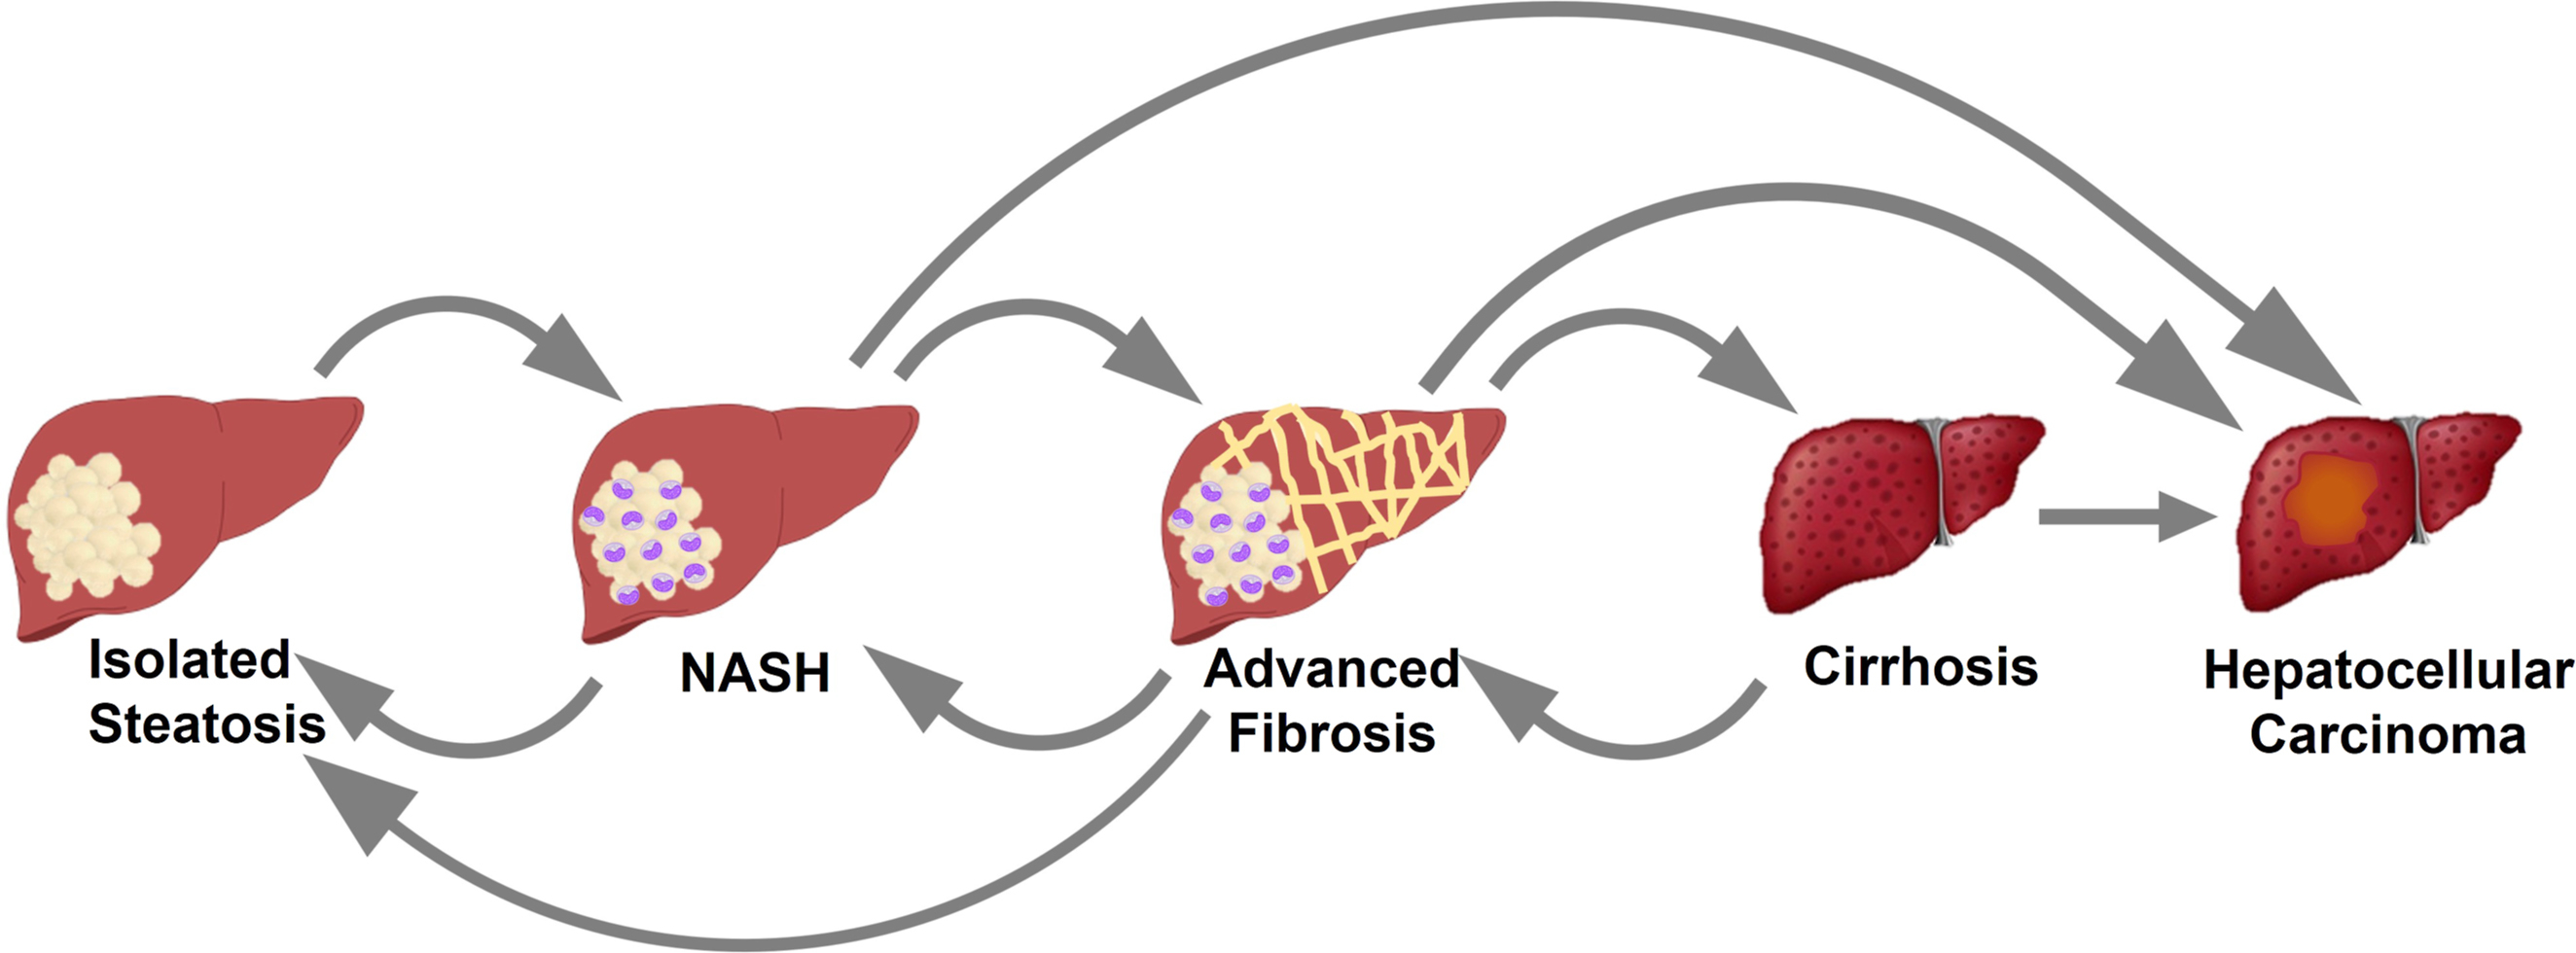
Unfortunately, the natural history of the disease is still incompletely understood. Longitudinal studies have suggested that the transition from NAFL (isolated steatosis) to NASH, advanced fibrosis, cirrhosis, and/or hepatocellular carcinoma (HCC) does not follow a linear pattern [ , ]. As represented in Fig. 12.2 , patients can move from one entity to another in different directions, as well as skipping steps. The concept that NAFL is a benign process with low likelihood of progression to more severe forms of liver disease was demystified by studies showing progression to NASH [ ] and even to advanced fibrosis [ ]. Spontaneous regression from NASH to NAFL was also observed [ ], finding that matches with the ∼15%–30% of resolution of NASH observed in placebo arms of randomized controlled trials [ ]. Fibrosis stage has also been shown to have bidirectional changes, either progressing or regressing with time [ ]. Presence of minimal inflammation or mild fibrosis was strong predictors of histological progression in these studies. Singh et al. estimated that among patients with NAFL, progression of one stage of fibrosis required an average of 14 years, while this time was reduced to 7 years in patients with NASH [ ]. Yet, these estimates are only a rough average, as significant subgroups of patients were shown to be rapid progressors, reaching advanced fibrosis in <5 years [ , ].
The development of advanced fibrosis and cirrhosis can eventually lead to HCC, need for a liver transplant, and/or other liver-related complications [ , ]. While only a minority of patients with NAFLD will eventually develop cirrhosis and liver-related complications, they still represent a massive number of patients due to the high prevalence of NAFLD. Among 2208 patients with cirrhosis, the leading etiology was NAFLD with an impressive 32% [ ]. Furthermore, NAFLD was the leading cause of transplant among women, and the third leading cause in men among more than 5000 liver transplant recipients [ ]. Compared to other etiologies of HCC, NAFLD is the one showing the fastest growth in the last 15 years [ ], suggesting that all these numbers are likely to continue to get worse. We are in the presence of a true epidemic with a significant clinical and economic toll. It was estimated that the overall prevalence of NAFLD will exponentially increase to 33.5% by 2030 [ ].
But the most dreadful epidemiological fact about NAFLD comes from its association with increased overall mortality. In large longitudinal studies, fibrosis stage, but not the presence of NASH, has been found to predict mortality in patients with NAFLD [ , ]. Moreover, this increase in mortality appears to develop even at lower stages of fibrosis [ ]. It is reasonable to think that with progression of histological liver disease comes an increase in liver-related mortality. However, the most frequent cause of death among patients with NAFLD is cardiovascular disease [ ]. For example, in a large meta-analysis ( n ∼34,000), it was estimated that NAFLD was associated with a ∼64% increase in fatal and nonfatal cardiovascular events after adjusting for other cardiovascular risk factors [ ]. It is currently unclear to what extent, or by what potential mechanisms, liver fibrosis stage could be associated with cardiovascular mortality. Moreover, a significant number of other confounding factors could be taking place. While Henson et al. found that advanced fibrosis and cirrhosis were associated with cardiovascular disease after adjusting for other confounding factors [ ], a larger study reported higher rates of cardiovascular events in patients with fibrosis stage 3 compared to cirrhosis [ ]. This suggests that other factors, irrespective of fibrosis stage, may be playing an important role in promoting cardiovascular events. Among these, metabolic derangements, such as insulin resistance, dyslipidemia, and hyperglycemia, may be at center stage.
3
NAFLD and diabetes: A killer duet?
The relationship between T2D and NAFLD is usually labeled as bidirectional and “complicated” [ , ]. Among patients with T2D, a meta-analysis estimated that the prevalence of NAFLD was ∼55% [ , ]. However, there is currently no evidence that hyperglycemia per se plays any role in the development of NAFLD. It is more likely that the increased prevalence of NAFLD in patients with T2D is related to common risk factors, such as obesity and insulin resistance. However, once NAFLD and T2D coexist, they tend to affect the progression of each other [ ].
Several longitudinal studies have reported a ∼2-fold increase in the incidence of diabetes among patients with NAFLD compared to those without NAFLD, even after adjusting for other metabolic parameters [ , ]. Whether these statistical approaches are able to really isolate the contribution of NAFLD, as compared to other metabolic abnormalities intrinsically present in these patients, is unclear. It could still be possible that insulin resistance, which is frequently higher in NAFLD patients, is the one promoting both the development of NAFLD and the higher incidence of T2D in these patients. Presence of NAFLD has also been associated with an increase in microvascular complications, such as retinopathy and nephropathy [ ]. Regardless of whether there is a pathogenic role or not, it appears that the presence of NAFLD is associated with a higher rate of development of T2D and worse microvascular complications [ , ], so these patients should be monitored closely.
On the other hand, the presence of diabetes appears to worsen the progression of NAFLD [ ]. In a large meta-analysis, Younossi et al. showed that among patients with T2D, NASH develops in ∼70% of patients with NAFLD [ ]. Moreover, 25% of patients with NASH and T2D had advanced fibrosis, compared to only 10% among those with NASH without T2D [ , ]. In a longitudinal study including 619 patients with NAFLD followed for a median time of 12.6 years, diabetes was significantly associated with increased overall mortality, need for liver transplantation, and liver-related events [ ].
It is still unclear what the mechanisms are for the faster progression of NAFLD in patients with T2D. While animal studies have suggested that hyperglycemia may independently induce liver inflammation [ ], evidence from human studies is lacking. Patients with type 1 diabetes appear not to have an increased prevalence of NAFLD as compared to the general population [ ], suggesting that hyperglycemia per se may not be responsible for liver disease. Moreover, treatment with metformin and/or insulin in treatment-naïve pediatric patients with T2D resulted in a significant reduction of hemoglobin A1c without improvement of liver biomarkers [ ]. Therefore, the role of hyperglycemia remains undetermined.
4
Pathogenesis of NAFLD
In this section, we will discuss the potential mechanisms responsible for the development and progression of NAFLD.
4.1
From metabolic health to NAFLD: What comes before NAFLD?
The specific mechanisms that lead to insulin resistance are only incompletely understood and have been reviewed elsewhere [ ]. In the majority of cases, the initial aggression is related to a net positive caloric balance and sedentarism, leading to obesity and adipose tissue hypertrophy. It is likely that adipose tissue hypertrophy results in multiple phenotypic changes at the cellular level, leading to insulin resistance and local inflammation [ ]. It is possible that these changes are somehow mediated by local hypoxia that develops due to a relative deficiency of vascular supply or an increased distance that oxygen needs to diffuse through to reach adipocytes. In turn, hypoxia may result in a myriad of cellular changes, such as expression of hypoxia-inducible factors, dysregulation of adipokine expression, endoplasmic reticulum and/or oxidative stress, and cytokine release [ ]. These changes result in increased insulin resistance of adipose tissue, with the consequent elevation in adipose tissue lipolysis (due to decreased inhibition of lipolysis by insulin) and higher concentrations of free fatty acids (FFA) [ ]. The close link between adipose tissue insulin resistance and the development of ectopic fat accumulation, including NAFLD, has been extensively reported [ ]. However, increased FFAs by themselves are likely not enough to induce NAFLD. As we mentioned above, patients with type 1 diabetes do not have a markedly elevated prevalence of NAFLD compared to the general population [ ]. Yet, due to insulin deficiency, these patients do have elevated FFA levels.
In addition to increased FFA flux, hyperinsulinemia appears to be crucial for the development of hepatic steatosis. Plasma insulin levels have been shown to be tightly correlated to the amount of liver fat accumulation [ , ]. This could be mediated by increased hepatic de novo lipogenesis (DNL), as insulin concentrations correlated with the degree of hepatic DNL in a group of patients with and without NAFLD [ ]. Lambert et al. also showed that patients with increased liver fat had a 3-fold increase in DNL when measured by stable isotope techniques [ ]. Moreover, this work found that this increase in DNL translated into a higher contribution to triglyceride secretion. Despite an elevation in adipose tissue-derived FFA levels, patients with and without elevated liver fat had a similar contribution from this source to triglyceride secretion. It is possible that the excess of adipose tissue-derived FFAs contributes more to increased beta-oxidation and tricarboxylic acid cycle (TCA) activity as previously reported in patients with hepatic steatosis [ ], than to triglyceride synthesis and secretion. All together, these results suggest a more significant impact on hepatic steatosis from changes in DNL than from increased adipose tissue derived FFAs. However, the debate is still open, and it is likely that both mechanisms may play key roles in the development of NAFLD.
Regardless of the mechanism (increased DNL vs. increased adipose tissue-derived FFA flux), these changes promote triglyceride accumulation in the liver, leading to NAFLD. There is growing evidence that triglyceride accumulation per se is not harmful for the liver, and it may actually work as a first defense mechanism against increased lipid influx [ ]. Only after this defense mechanism is overcome, cellular damage ensues leading to NASH, as described below.
4.2
From steatosis to nonalcoholic steatohepatitis and fibrosis: Lipotoxicity
At some point, and for mechanisms that are still unclear, liver fat accumulation is unable to continue to compensate for increased influx of lipids, and inflammation and necrosis develop. Several different mechanisms have been postulated as potentially responsible for this transition. Among these, accumulation of lipid intermediates (such as diacylglycerols [DAGs] and ceramides), mitochondrial dysfunction, endoplasmic reticulum stress, oxidative stress, impaired autophagy, genetic factors, specific cytokines and adipokines, microbiome-related factors, etc. have all been extensively explored [ ]. It is likely that a combination of these mechanisms determines the timing and severity of the progression of the disease. It is beyond the scope of this chapter to review in depth these mechanisms responsible for the transition to NASH and eventually to advanced fibrosis and cirrhosis.
The term lipotoxicity was originally introduced to describe the effects of fat accumulation in pancreatic β-cells. However, it has lately been used to refer to any deleterious effects resulting from abnormal fat accumulation in ectopic tissues [ ]. In this setting, the changes observed in the liver should not be considered as an isolated process. On the contrary, these patients have ectopic fat accumulation in different tissues, such as skeletal and myocardial muscle, pancreas, and kidney, and it is likely that similar processes are taking place in these tissues [ ]. Thus, an important concept is that NAFLD should be viewed as a marker of a systemic condition mainly characterized by metabolic dysregulation, even in lean individuals [ ]. This is the reason for the nomenclature change described at the beginning of the chapter and the introduction of the MASLD definition.
However, it should be noted that some studies have identified lean patients with NAFLD without metabolic derangements (i.e., these patients would not qualify as having MASLD by the new definition). For example, Luukkonen et al. [ ] described subtypes of NAFLD based on insulin resistance and genetic markers and identified patients with a specific single nucleotide polymorphism (PNPLA3 I148M) that were more likely to have NAFLD with less significant insulin resistance. Moreover, PNPLA3 I148M was significantly present among lean NAFLD patients without T2D [ ]. Therefore, it is possible that among all the mechanisms leading to NAFLD and NASH, there is a small subset of patients that have a genetically acquired fatty liver disease (GAFLD) with no or minimal metabolic manifestations [ ]. However, recent data from our group (unpublished) suggests that even in the presence of PNPLA3, adipose tissue insulin resistance is still required to develop NAFLD.
5
Systemic conditions associated with NAFLD
5.1
Dyslipidemia
The presence of NAFLD is associated with worse dyslipidemia [ ]. The mechanisms leading to this are likely related to hepatic insulin resistance, increased fat storages, and hyperinsulinemia. Due to increased liver insulin resistance, insulin fails to inhibit VLDL secretion [ ]. In addition to more VLDL particles, each of them is highly enriched with triglycerides that appear to originate from local sources (i.e., DNL) rather than from adipose tissue-derived FFAs [ ]. Therefore, hyperinsulinemia also plays an important role stimulating hepatic DNL. Interestingly, in the study by Fabbrini et al. [ ], they observed that VLDL-TG secretion was linearly correlated with liver fat content until patients reached ∼10% of liver fat. After this threshold was reached, VLDL-TG secretion plateaued, as it was unable to continue increasing to compensate for elevated lipid influx to the liver.
In normal conditions, VLDL particles exchange triglycerides and cholesterol with other lipoproteins in the circulation, such as HDL and LDL particles. As a consequence of the TG-rich VLDL particles, HDL and LDL receive increasing amounts of triglycerides in these patients. Once lipases break down these triglyceride molecules, the result is significantly smaller molecules of LDL and HDL (i.e., less content of cholesterol per particle). Small HDL particles get cleared by the kidneys leading to reduced HDL-C content. Small and dense LDL particles are well-known to be highly atherogenic. Thus, the resultant dyslipidemia associated with NAFLD is characterized for high triglycerides, low HDL-C, and small and dense LDL particles. In line with these, patients with NAFLD have been shown to have more LDL particles, higher ApoB levels, lower ApoA1 levels, and decreased LDL particle size [ ]. These changes appear to be more related to presence of insulin resistance and NAFLD than obesity. Moreover, the presence of more severe liver histology is not associated with worsening dyslipidemia in these patients [ ].
5.2
Hypertension
Both cross-sectional and longitudinal studies have showed that NAFLD and hypertension are strongly associated even after adjustment for other metabolic parameters [ , ]. Unfortunately, despite statistical approaches to try to isolate the effect of NAFLD on hypertension, and vice versa, due to common clustering of metabolic abnormalities, it is impossible to specifically state how much liver steatosis actually contributes to hypertension. Several confounding factors could be participating in this relationship, such as insulin resistance, systemic lipotoxicity, and subclinical inflammation. Of these, renal lipotoxicity has been receiving increasing attention in the literature, with few studies suggesting a parallelism between the mechanisms leading to NASH and liver fibrosis and those leading to CKD in obesity and insulin resistance [ ].
5.3
Polycystic ovarian syndrome
Similarly to what happens with several other endocrinopathies that have been associated with NAFLD, it is unclear whether one leads to the other, or on the contrary, if they are both the common final pathway of obesity and insulin resistance. Regardless of the nature of the relationship, it is clear that the presence of one of these entities (either NAFLD or PCOS) should prompt healthcare providers to screen for the other one. Cerda et al. showed that patients with PCOS had a higher prevalence of NAFLD by ultrasound when compared to age- and BMI-matched healthy women (41% vs. 19%, n = 72) [ ]. These results have been consistently replicated in different cohorts throughout the world and confirmed by a recent meta-analysis [ ]. Higher prevalence of NAFLD among women with PCOS appears to occur irrespectively of the BMI and age of the patients. It has been postulated that hyperandrogenism observed in patients with PCOS plays a role in the development of NAFLD. In support of this, both total and free testosterone levels have been found to be increased in patients with PCOS and NAFLD compared to patients with PCOS alone [ ].
5.4
Hypogonadism
On the opposite end of the spectrum, NAFLD has also been associated with decreased testosterone levels in male patients [ , ]. However, this association is difficult to assess due to the significant effects of obesity in the hypothalamic-pituitary-gonadal axis. Several mechanisms have been postulated for this association, including neuronal insulin resistance, leptin resistance in the hypothalamus, increasing conversion of androgens to estrogen by adipose tissue aromatase, kisspeptin deficiency, increased inflammatory markers, etc. [ ]. Moreover, obesity is associated with a reduction in sex hormone–binding globulin (SHBG) levels, making studies that have used total testosterone difficult to interpret. Whether NAFLD has an added effect to that observed with obesity remains a matter of discussion. Several observations appear to suggest that indeed liver disease may have specific effects on testosterone levels. For example, a recently published study by Sarkar et al. [ ] showed that histological severity of liver disease and fibrosis staging were associated with low free testosterone levels, independently of other metabolic factors such as insulin resistance and waist circumference. However, these results were not replicated by Dayton et al. [ ] among 175 male subjects with T2D. In this study, no differences were observed in free testosterone based on the degree of liver disease. The debate is still open, and while current guidelines do not recommend for routine screening of men for hypogonadism, the presence of NAFLD should lower the threshold to consider testing for hypogonadism in these patients.
5.5
Hypothyroidism
Increasing number of studies in the last few years have described an association between NAFLD and thyroid hormone levels. Using magnetic resonance imaging and proton spectroscopy, we observed an inverse correlation between free T4 concentration and the amount of liver fat [ ]. Moreover, free T4 levels have also been linked to the severity of histological liver parameters (i.e., inflammation, necrosis, or fibrosis) [ ]. The potential mechanisms to explain this association are numerous, and they are believed to be both intrahepatic (i.e., reduced fatty acid oxidation in the liver) and extrahepatic (reduced insulin suppression of adipose tissue lipolysis) [ ]. In line with these findings, Resmetirom, a liver-specific thyroid hormone receptor-β agonist, was found to reduce liver fat accumulation after 12 and 36 weeks of treatment in patients with NASH [ ]. Therefore, in patients with hypothyroidism and elevated BMI (overweight/obese) and/or metabolic abnormalities, screening for NAFLD should be considered.
5.6
Cardiovascular disease
There is ample evidence that patients with NAFLD have increased cardiovascular disease. In a meta-analysis of 16 observational studies ( n = 34.043), NAFLD was associated with a 64% increase of fatal and nonfatal cardiovascular events after ∼7 years of follow-up [ ]. However, it is not clear whether NAFLD is a risk factor for cardiovascular disease or just a marker for it. In other words, it is unknown whether NAFLD per se plays any role in the development and progression of cardiovascular disease. It is possible that other metabolic abnormalities that are linked to these two entities (i.e., NAFLD and cardiovascular disease) may be confounding this association. This also applies to studies that have reported that liver fibrosis stage could also be associated with cardiovascular mortality [ ]. Potential mechanisms that could be working as a link between NAFLD and cardiovascular disease include: atherogenic dyslipidemia, worse hypertension, endothelial dysfunction, worse insulin resistance and hyperinsulinemia, subclinical inflammation, etc. Moreover, the link between NAFLD and cardiovascular disease goes beyond the typical coronary artery disease, as NAFLD has also been linked to increased cardiac arrhythmias, as well as cardiomyopathy.
A recent review article summarized the evidence linking NAFLD and atrial fibrillation, as well as other conduction defects [ ]. However, other metabolic risk factors are the most likely explanation for this association. It is also possible that fat accumulation in myocardial cells could be contributing to abnormal cardiac rhythms. The process of fat accumulation that takes place in the liver is likely to occur in other organs as well. As we mentioned above, NAFLD is the liver manifestation of a systemic lipotoxic state that affects multiple organs. In this setting, patients with NAFLD have increased amounts of intramyocardial fat, and this is associated with diastolic dysfunction [ , ].
6
Diagnosis
Early diagnosis of NAFLD is of paramount importance if we want to change the natural history of the disease. As we will describe in the next section, no currently approved medication has been successful to significantly decrease liver fibrosis in patients with NAFLD [ ]. Therefore, there is a need for early treatment, in order to resolve NASH and prevent the progression to advanced fibrosis.
The gold-standard for the diagnosis of NAFLD is a liver biopsy [ ]. However, due to high costs and potential complications, patients and physicians oftentimes are reluctant to undergo such procedure. The advantage of the biopsy is that at the same time, it quantifies liver fat, makes the diagnosis of NASH, establishes the severity of liver disease, rules out other liver conditions, and quantifies the stage of fibrosis. However, it also presents some shortcomings in addition to costs and potential side effects. As NAFLD can be unevenly distributed, it is prone to sampling variation [ ]. There is also significant interobserver variability in histological readings [ ], with agreements in the range of only 62%–75% for each of the histological parameters, even among experienced pathologists despite a “controlled” setting, such as a randomized trial [ ]. Due to the limitations of the liver biopsy, many different noninvasive diagnostic tools have been developed and they are available for use. Therefore, it is important to understand the real utility of each of them, in order to choose wisely when in front of our patients. Their main use is to either diagnose NAFLD, NASH, and/or fibrosis avoiding the need for a liver biopsy or, on the contrary, selecting those patients at high-risk that should be later selected to undergo a liver biopsy.
They can be divided in three groups depending on whether they are trying to detect steatosis, NASH, or fibrosis. Moreover, they can subsequently be divided in three groups depending on whether they are serum biomarkers, imaging techniques, or clinical scores (i.e., a combination of serum parameters with anthropometric and demographic information). In Tables 12.1–12.3 , we have summarized most of the noninvasive techniques currently available.
| Diagnostic tool | n | Population characteristics | AUROC | Components | Reference | Gold-standard |
|---|---|---|---|---|---|---|
| Serum biomarkers | ||||||
| ALT | 336 | Europe | 0.83 (0.79, 0.88) | ALT | [ ] | 1 H-MRS |
| Mean BMI 30.2 kg/m 2 | ||||||
| NAFLD 50%. | ||||||
| ALT x intact insulin | 98 | USA | 0.94 (0.89–0.99) | ALT, insulin | [ ] | 1 H-MRS and biopsy |
| Mean BMI 32.9 kg/m 2 | ||||||
| NAFLD 63%; diabetes 0% | ||||||
| TyG index | 324 | Europe | 0.90 (0.84–0.94) | TG, glucose | [ ] | Biopsy |
| Mean BMI 29.7 kg/m 2 | ||||||
| NAFLD 95%; diabetes 41% | ||||||
| Imaging biomarkers | ||||||
| Ultrasound | 146 | USA | 0.82 (0.69–0.94) | – | [ ] | Biopsy |
| Mean BMI 34.1 kg/m 2 | ||||||
| NAFLD 66%; diabetes 54% | ||||||
| CT | 161 | South Korea | 0.65 (0.58–0.73) | – | [ ] | Biopsy |
| Mean BMI 23.4 kg/m 2 | ||||||
| NAFLD 37%. | ||||||
| CAP | 1297 | Meta-analysis | 0.96 ± 0.01 | – | [ ] | Biopsy |
| N/A | ||||||
| 1 H-MRS | 146 | USA | 0.96 (0.90–1.00) | – | [ ] | Biopsy |
| Mean BMI 34.1 kg/m 2 | ||||||
| NAFLD 66%; diabetes 54% | ||||||
| MRI-PDFF | 412 | Meta-analysis | 0.98 (0.96–0.99) | – | [ ] | Biopsy |
| NAFLD 95%. | ||||||
| Clinical scores | ||||||
| HSI | 324 | Europe | 0.81 (0.71–0.88) | BMI, sex, diabetes, ALT, AST | [ ] | Biopsy |
| Mean BMI 29.7 kg/m 2 | ||||||
| NAFLD 95%; diabetes 41% | ||||||
| FLI | 324 | Europe | 0.83 (0.72–0.91) | BMI, WC, TG and GGT | [ ] | Biopsy |
| Mean BMI 29.7 kg/m 2 | ||||||
| NAFLD 95%; diabetes 41% | ||||||
| NAFLD-LFS | 324 | Europe | 0.80 (0.69–0.88) | MS, diabetes, insulin, ALT, AST. | [ ] | Biopsy |
| Mean BMI 29.7 kg/m 2 | ||||||
| NAFLD 95%; diabetes 41% | ||||||
| Steatotest | 600 | Europe | 0.82 (0.80–0.84) | Age, gender, BMI, α2-MG, Apo-A1, haptoglobin, bilirubin, GGT, TC, TG, glucose, ALT | [ ] | Biopsy |
| Mean BMI 29.7 kg/m 2 | ||||||
| NAFLD 97%; diabetes 23% | ||||||
| OWLiver care test | 220 | USA | 0.64 (0.56–0.71) | BMI, 11 TG species | [ ] | 1 H-MRS and biopsy |
| Mean BMI 33.7 kg/m 2 | ||||||
| NAFLD 70%; diabetes 100% | ||||||
| Lipid accumulation product | 336 | Europe | 0.78 (0.72, 0.83) | WC, TG | [ ] | 1 H-MRS |
| Mean BMI 30.2 kg/m 2 | ||||||
| NAFLD 50%. | ||||||
| Dallas Steatosis index | 2139 | USA | 0.82 (0.80–0.84) | Age, sex, diabetes, hypertension, ethnicity, TG, glucose, ALT, BMI | [ ] | 1 H-MRS |
| Median BMI 28 kg/m 2 | ||||||
| NAFLD 31%; diabetes 11% | ||||||
| Diagnostic tool | n | Population characteristics | AUROC | Components | Reference | Gold-standard |
|---|---|---|---|---|---|---|
| Serum biomarkers | ||||||
| ALT | 222 | USA | 0.62 | – | [ ] | Biopsy |
| Mean BMI 37.6 kg/m 2 | ||||||
| NASH 24%; diabetes 33% | ||||||
| CK-18 | 318 | USA | 0.65 (0.59–0.71) | – | [ ] | Biopsy |
| Mean BMI 32.9 kg/m 2 | ||||||
| NASH 63%; diabetes 43% | ||||||
| NAFIC score | 442 | Japan | 0.78 | Ferritin, insulin, type IV collagen 7s | [ ] | Biopsy |
| Mean BMI 27.9 kg/m 2 | ||||||
| NASH 55%; diabetes 43% | ||||||
| Imaging biomarkers | ||||||
| Multiparametric MRI (cT1 mapping) | 145 | Japan | 0.75 (0.67–0.84) | – | [ ] | Biopsy |
| Mean BMI 28.8 kg/m 2 | ||||||
| NASH 60%; diabetes 67% | ||||||
| Clinical scores | ||||||
| BARD score | 827 | USA | 0.78 | BMI, diabetes, AST, ALT | [ ] | Biopsy |
| Median BMI 33 kg/m 2 | ||||||
| NASH 81%; diabetes 35% | ||||||
| HAIR score | 453 | Korea | 0.67 (0.60–0.73) | Hypertension, 1/QUICKI, ALT | [ ] | Biopsy |
| Mean BMI 27.4 kg/m 2 | ||||||
| NASH 47%; diabetes 39% | ||||||
| OWLiver | 220 | USA | 0.69 (0.62–0.77) | BMI, 20 TG species | [ ] | Biopsy |
| Mean BMI 33.7 kg/m 2 | ||||||
| NASH 52%; diabetes 100% | ||||||
| Actitest | 1081 | Europe | 0.78 (0.74–0.81) | Age, sex, α2-MG, Apo-A1, haptoglobin, bilirubin, GGT, ALT. | [ ] | Biopsy |
| Mean BMI 36.9 kg/m 2 | ||||||
| NASH 51%; diabetes 33% | ||||||
| NASHtest | 257 | Europe | 0.78 (0.71–0.83) | Age, sex, weight, height, α2-MG, Apo-A1, haptoglobin, bilirubin, GGT, AST, ALT, TG, TC | [ ] | Biopsy |
| Mean BMI 28.7 kg/m 2 | ||||||
| NASH 25%; diabetes 37% | ||||||
| NICE model | 464 | Europe | 0.83∗ | MS, ALT, CK-18 | [ ] | Biopsy |
| Mean BMI 44.5 kg/m 2 | ∗ for prediction of NAS≥5 | |||||
| NASH 11%; diabetes 23% | ||||||
| NASH ClinLipMet score | 318 | Europe | 0.87 (0.82–0.91) | PNPLA3 genotype, AST, insulin, glucose, metabolomics data | [ ] | Biopsy |
| Mean BMI 39.9 kg/m 2 | ||||||
| NASH 22%; diabetes 22% | ||||||
| oxNASH | 73 | USA | 0.83 (0.73–0.93) | Age, BMI, AST, 13-hydroxy-octadecadenoic acid, linoleic acid | [ ] | Biopsy |
| Mean BMI 31.1 kg/m 2 | ||||||
| NASH 51%; diabetes 30% | ||||||
Related posts:
 Overview on chronic complications of diabetes mellitus
 Molecular mechanisms involved in hyperglycemia-induced cellular damage
 Epidemiology of chronic complications of diabetes: A global perspective
 Diabetic retinopathy: New insights
 Diabetic neuropathy: Current issues in diagnosis and prevention
 Retinal neurodegeneration: Importance in diabetes management
Stay updated, free articles. Join our Telegram channel

Full access? Get Clinical Tree


