General Overview and Incidence
Multiple myeloma (MM) is a malignancy of clonal plasma cells and is part of a spectrum of plasma cells disorders encompassing the benign asymptomatic condition monoclonal gammopathy of unknown significance (MGUS), smoldering MM (SMM), symptomatic MM, and the more aggressive forms such as plasma cell leukemia with circulating myeloma cells in the peripheral blood ( Fig. 14.1 ). In 1850, Dr. Henry Bence Jones described the first myeloma patient, Thomas Alexander McBean, who presented with symptoms of fatigue, diffuse bone pain, and urinary frequency. Bence Jones proteins were detected in the urinalysis. Over the next decade, multiple advances such as x-ray, bone marrow examination, and immunoelectrophoresis have helped to define the disease further.

The plasma cells in MM are dysfunctional and, in most cases, produce a monoclonal immunoglobulin (Ig) that can be classified into five subtypes: IgG, IgA, IgM, IgD, and IgE. Infrequently, heavy-chain components of the immunoglobulin are not produced by the myeloma cells and the disease manifests as production and secretion of light-chain only, which would either be κ or λ type. Very rarely, myeloma fails to produce any significant amount of protein and would manifest as a nonsecretory MM.
MM accounts for 1% of all malignancies and is the second most common hematologic malignancy, with prevalence of around 10%. The lifetime risk of MM is 1 in 143 (0.7%). The American Cancer Society estimated about 30,280 new cases would be diagnosed (17,490 in men and 12,790 in women) and 12,590 deaths were expected to occur (6,660 in men and 5,930 in women) in the United States in 2017. Increase in the incidence rate (MM cases per 100,000 persons) was significantly higher among non-Hispanic white (NHW) women (4.15–4.36; P = .05), NHW men (6.39–7.22; P < .001), and non-Hispanic black (NHB) men (13.94–16.15; P < .01), but not among NHB women (10.96–11.57; P = not significant [NS]), Hispanic men (6.46–6.45; P = NS), or Hispanic women (4.24–4.39; P = NS). The median age at diagnosis decreased from 73 to 71 years among NHW women ( P < .001), whereas no notable difference in age at diagnosis was observed for NHW men (71–70 years; P = NS), NHB women (68–66 years; P = NS), NHB men (67–66 years; P = NS), Hispanic women (67–67 years; P = NS), or Hispanic men (66–65 years; P = NS). The finding of increased incidence of MM and younger age at diagnosis in select populations could be due to earlier identification of cases. Therefore, early diagnosis could imply longer survival by detecting SMM cases sooner or by offering early life-extending therapies to MM patients.
Etiology and Histopathology
The etiology of MM and MGUS is not entirely clear. However, several risk factors include immune-mediated conditions such as autoimmune and inflammatory diseases and exposure to toxic substances such as pesticides. Studies have also found increased risks seen in first-degree relatives of MM patients, suggesting genetic factors in the pathogenesis. , The bone marrow microenvironment, mediated by cytokines and growth factors, plays an important role in the proliferation of the neoplastic plasma cells and disease progression.
Nearly all cases of smoldering and symptomatic MM are preceded by MGUS, an asymptomatic premalignant condition. MGUS can be categorized into IgM and non-IgM subtypes, which differ in their modes of progression. IgM-type MGUS can progress to Waldenström macroglobulinemia (WM), other non-Hodgkin lymphoma or light-chain (AL) amyloidosis at a rate of 2% per year in the first 10 years after diagnosis and 1% per year thereafter, whereas non-IgM MGUS is associated with progression to MM, plasmacytoma, or AL amyloidosis at a rate of approximately 1% per year independent of duration of follow-up. Risk factors for progression of disease to MM or lymphoma include concentration of M-protein and abnormal ratio of serum κ and λ light chains. ,
The classification of plasma cell neoplasm requires integration of clinical, laboratory, and pathologic features ( Table 14.1 ). The myeloma defining events described in the diagnostic criteria include CRAB features (hyper C alcemia, R enal insufficiency, A nemia, B one lesions) and biomarkers of malignancy (SLiM features [ S ixty percent clonal bone marrow plasma cells, serum-free Li ght-chain ratio; M agnetic resonance focal]) ( Box 14.1 ). The biomarkers of malignancy identify patients who do not exhibit end-organ damage but are at high risk of disease progression to symptomatic MM and therefore should be offered therapy. Bone marrow examination is essential in the diagnostic workup of MGUS and MM to document the extent of infiltration of the neoplastic plasma cells. The evaluation includes immunophenotyping and morphologic evaluation of the aspirate smears, as well as cytogenetic and molecular studies essential for prognostication. Bone marrow plasma cell percentage should be estimated from a core biopsy sample. Discrepancies between the aspirate and core biopsy can occur for a variety of reasons, including technical factors from sample preparation or patchy or localized distribution of the neoplastic plasma cells. In these settings, the highest value should be used for disease classification or characterization.
| Plasma Cell Neoplasm | Diagnostic Criteria |
|---|---|
| MGUS, non-IgM type | Serum M protein <3 g/dL Clonal BM plasma cells <10% Absence of myeloma-defining events (CRAB or SLiM features) |
| MGUS, IgM type | Serum M protein <3 g/dL BM lymphoplasmacytic infiltrate <10% Absence of lymphadenopathy, hepatosplenomegaly, anemia, hyperviscosity attributable to an underlying lymphoproliferative disorder |
| Smoldering multiple myeloma, inactive disease | Serum M protein ≥3 g/dL or urine M protein ≥500 mg/24 h and/or clonal BM plasma cells 10%–60% and Absence of myeloma-defining events (CRAB or SLiM features) |
| Symptomatic multiple myeloma | Clonal BM plasma cells ≥10% or plasmacytoma (bony or extramedullary) and One or more myeloma-defining events (CRAB and SLiM features) |
| Solitary plasmacytoma | No M protein in serum and/or urine Single area of bone destruction due to clonal plasma cells Bone marrow biopsy showing <10% clonal plasma cells a , b Absence of myeloma-defining events (CRAB or SLiM features) Normal skeletal survey and MRI/CT (excluding plasmacytoma) |
| Nonsecretory myeloma | No M protein in serum and/or urine with immunofixation Bone marrow clonal plasma cells ≥10% or plasmacytoma Presence of myeloma-defining events (CRAB or SLiM features) |
| Primary light-chain (AL) amyloidosis | Presence of amyloid-related systemic syndrome (renal, cardiac, liver) Detection of Congo red–positive amyloid in any tissue Confirmation of light-chain–related amyloid by mass spectrometry Evidence of a monoclonal plasma cell proliferative disorder such as serum or urine M protein, abnormal free light-chain ratio or clonal plasma cells in the bone marrow |
| Amyloidosis with multiple myeloma | Features of AL amyloidosis as above and ≥10% clonal plasma cells |
a The progression rate for cases without BM clonal plasma cells is approximately 10% within 3 years, whereas the progression rate is higher (60% for bony lesions and 20% of extramedullary lesions) when clonal BM plasma cells are detected (<10%); clonal plasma cells >10% in the bone marrow.
b Solitary plasmacytoma with more than 10% clonal plasma cells would be classified as multiple myeloma.
CRAB Features
- 1.
Hyper C alcemia (>11.5 mg/dL)
- 2.
R enal insufficiency (creatinine >2 mg/dL or creatinine clearance <40 mL/min)
- 3.
A nemia (hemoglobin <10 g/dL or 2 g/dL < normal)
- 4.
B one lesions (≥1 osteolytic lesions identified on skeletal radiography, MRI, or PET/CT a
a Increased uptake alone in PET/CT is insufficient. Osteoporosis or vertebral compression fractures without lytic lesions are insufficient evidence of bone disease for the diagnosis of multiple myeloma.
)
Biomarkers of Malignancy (SLiM Features)
- 1.
≥ S ixty-percent clonal bone marrow plasma cells
- 2.
Serum-free Li ght chain-ratio (ratio of involved to uninvolved serum free light chain) ≥100
- 3.
≥1 M RI focal lesions (lesions must be ≥5mm) b
b If focal lesions are less than 5 mm or equivocal, CT or PET/CT should be undertaken for further characterization of the lesions.
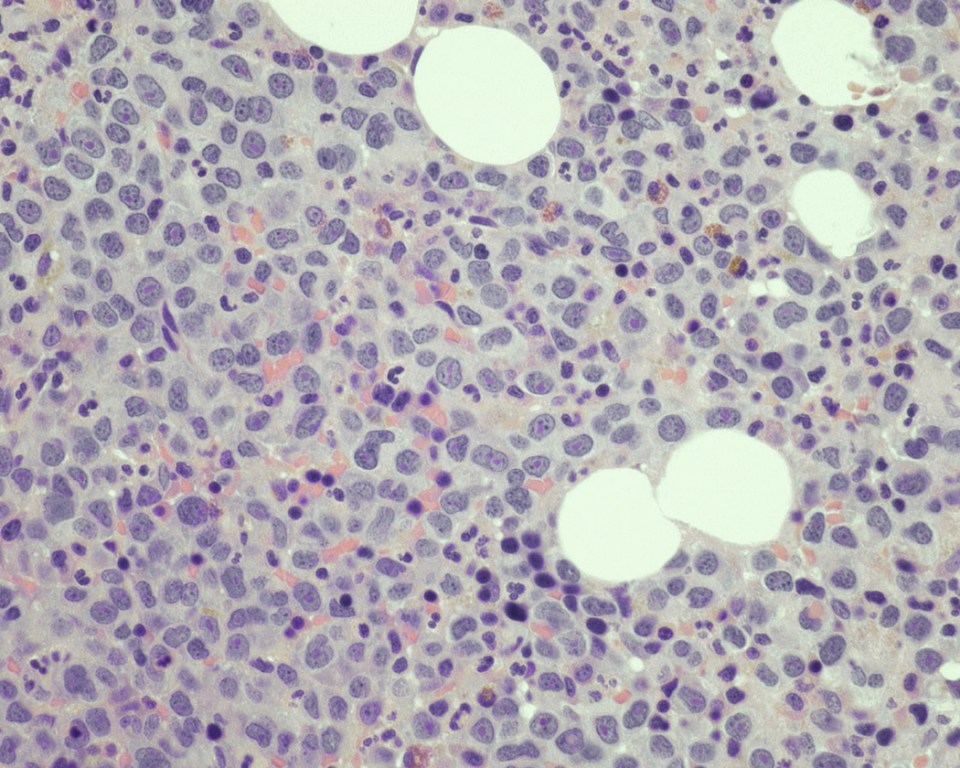
Normal nonneoplastic plasma cells are characterized by eccentrically placed nuclei, ample blue cytoplasm, paranuclear hof, condensed and clumped chromatin, and inconspicuous nucleoli ( Fig. 14.2 ). Neoplastic plasma cells can exhibit a wide variety of morphologic features from normal mature morphology ( Fig. 14.3 ) to cells with immature features. Immature features include open or fine blastlike chromatin, prominent nucleoli, and centrally placed nuclei ( Figs. 14.4–14.8 ). Occasionally, neoplastic plasma cells may have atypical or unusual morphology without any resemblance of their plasma cell origins. They may appear lymphoplasmacytoid, monocytoid, anaplastic, or even multinucleated, sometimes mimicking osteoclasts ( Figs. 14.9–14.11 ). In these cases, a panel of antibodies including a CD138 stain is useful in classifying these cells as neoplastic plasma cells.


Russell bodies and Dutcher bodies are spherical cytoplasmic inclusions composed of accumulation of immunoglobulins. , Dutcher bodies are cytoplasmic inclusions that invaginate into or overlie the nucleus and are called pseudo-nuclear inclusions ( Figs. 14.12 and 14.13 ), whereas Russell bodies are seen clearly within the cytoplasm ( Fig. 14.14 ). , Mott cells are plasma cells that show accumulation of multiple Russell bodies ( Fig. 14.15 ). Russell bodies, Dutcher bodies, and Mott cells are not specific to neoplastic plasma cells and can be appreciated in B-cell neoplasms and reactive plasma cells. Rarely, crystalline cytoplasmic structures are appreciated and may be rod-, needle-, or rhomboid-shaped ( Fig. 14.16 ). These structures are also thought to be composed of light-chain proteins. , Erythrophagocytosis in MM is also a rare finding ( Fig. 14.17 ).


Neoplastic plasma cells can show different patterns of marrow infiltration. They can be scattered interstitially, forming small loose clusters, or show extensive sheets ( Fig. 14.18 ). They can also form patchy/localized aggregates ( Fig. 14.19 ), which shows how sampling can affect bone marrow evaluation in the extent of involvement and underscores the importance of corroboration of trephine biopsy and aspirate smear results.


Extramedullary myeloma is the proliferation of neoplastic plasma cells at a site away from the bone marrow space and can be seen in a third of MM cases. It can be present at initial diagnosis, during the course of disease, or at relapse. Typical areas of involvement include central nervous system, lymph nodes, kidneys, skin, liver, and pancreas ( Fig. 14.20 ). It is associated with adverse prognosis, particularly in the setting of relapsed disease. Potential mechanisms of extramedullary spread include altered adhesion molecules, chemokine receptors, and angiogenesis. Solitary plasmacytoma is a distinct entity from extramedullary myeloma. It is a localized proliferation of neoplastic plasma cells without systemic involvement and lacks myeloma-related symptoms ( Table 14.1 ).

Peripheral blood involvement by neoplastic plasma cells can also occur and can be classified as primary or secondary. Both subtypes are associated with poor prognosis, and they are defined as the presence of more than 20% plasma cells in the peripheral blood or an absolute plasma cell count greater than 2 × 10 9 cells/L. Neoplastic plasma cells in primary plasma cell leukemia often exhibit decreased expression of CD56. Other findings in the peripheral blood smear of patients with MM may include rouleaux formation, where red blood cells form a linear arrangement and have the appearance of a “stacks of coins.” This is a result of elevated plasma proteins such as fibrinogen and globulins. The positively charged plasma proteins neutralize the negative charge of red cells and promote aggregation ( Fig. 14.21 ). It is important to evaluate for this morphologic feature only in thin areas of the peripheral blood smear as rouleaux formation can be seen as an artifact in thick areas of the smear. Rouleaux formation is different from red cell agglutinates that form as a result of IgM antibodies (cold agglutinins). These agglutinates form irregular clusters of red cells as a result of the IgM antibodies forming a lattice between red cells.

The differential diagnosis of increased bone marrow plasma cells includes reactive plasmacytosis, which can be seen in many nonneoplastic conditions, such as infections, autoimmune conditions, inflammatory conditions, and therapy effects. In reactive plasmacytosis the plasma cells are dispersed interstitially and may form small, loose clusters occasionally around blood vessels. This topographic pattern is not specific, however, and demonstration of a polytypic κ and λ light-chain expression pattern and lack of aberrant marker expression are important in confirming their nonneoplastic nature ( Fig. 14.22 ). Cytologically, nonneoplastic plasma cells show normal mature morphologic features and may occasionally exhibit binucleation, Russell bodies, Mott cells, or Dutcher bodies. Immature features, however, are not typical of reactive plasma cells and would suggest a neoplastic process.

NHL exhibiting plasmacytic differentiation is another important differential diagnosis. Lymphoplasmacytic lymphoma (LPL) and marginal zone lymphoma commonly show plasmacytic differentiation and at times can be prominent/marked. Other B-cell lymphomas, such as chronic lymphocytic leukemia, mantle cell lymphoma, and follicular lymphoma, can also exhibit plasmacytic differentiation, but it is uncommon. In B-cell lymphoproliferative disorders with plasmacytic differentiation, separate neoplastic B-cell and plasma cell populations may be detected by flow cytometric and/or immunohistochemical studies demonstrating concordant light-chain restriction. However, immunophenotyping by these methods have limitations, and the two populations may not always be easily detected. For example, flow cytometric studies often underestimate the percentage of plasma cells. Discordant light-chain restriction between these two populations would suggest two independent neoplastic processes: a B-cell lymphoma and a plasma cell neoplasm. In addition to light chains, the neoplastic plasma cell component in B-cell lymphomas would typically express CD45 and CD19 and lack expression of typical aberrant markers in MM such as CD56. Evaluation of these additional aberrant markers is important in further confirmation of the nature of the plasma cells. MYD88 L265P mutation analysis can be useful in the workup as it is seen in the vast majority of lymphoplasmacytic lymphoma, uncommonly in other low-grade B-cell lymphomas, and is virtually absent in MM ( Figs. 14.23 and 14.24 ). , These cases highlight the importance of a multimodal diagnostic approach including a comprehensive panel of antibodies for immunophenotyping, and cytogenetic and molecular studies are essential in arriving at a diagnosis.


Amyloid is extracellular deposition of abnormally folded proteins that form β-pleated sheets, and AL amyloidosis is one of many subtypes of amyloidosis that have been described. It involves the deposition of immunoglobulin light chains, more often of the λ isotype, and is associated with a B-cell or plasma cell disorder. Other subtypes such as secondary AA amyloidosis and ATTR amyloidosis are associated with serum amyloid A protein in chromic inflammation and wild-type or variant transthyretin, respectively. Diagnosis of amyloid requires microscopic examination of involved tissue. Hematoxylin-eosin–stained sections of involved tissue show amorphous eosinophilic material in the extracellular space. Congo red stain is a commonly used technique in the assessment of amyloid. The dye binds to the β-pleated sheet structures of amyloid and imparts a pink color under light microscopy and produces a green birefringence under polarized light ( Fig. 14.25 ). Subtyping of the amyloid deposits is critical for appropriate management of patients and can be achieved with mass spectrometry–based studies. Sensitivity rates differ in the type of tissue sample obtained for amyloid evaluation. Biopsy of an affected organ/tissue has the highest sensitivity (>90%); however, this may be invasive, associated with morbidity, and technically complex. A common biopsy site and technique for the evaluation of amyloid is abdominal subcutaneous fat aspiration, which is easily performed with rapid turnaround. It has been found to have sensitivity ranging from 55% to 80% and a high specificity approaching 100% in the detection of amyloid. , Rectal biopsy has been found to have comparable sensitivity to subcutaneous fat aspiration (∼70%), whereas a bone marrow biopsy has lower sensitivity. ,

Kidney disease is a frequent complication of monoclonal gammopathies that manifests with a wide range of renal lesions from direct deposition of the monoclonal immunoglobulin involving the glomeruli, tubules, interstitium, or vessels or from indirect mechanisms such as inhibiting regulation of the alternative pathway of the complement ( Table 14.2 ). The term “monoclonal gammopathy of renal significance” (MGRS) has been introduced to indicate that although the patient has MGUS, the renal lesion is nevertheless a consequence of the monoclonal protein and thus has major implications for management and prognosis. These patterns are mostly determined by the physicochemical characteristics of the pathogenic monoclonal immunoglobulin.
| Disease | Light Microscopy | Immunofluorescence | Electron Microscopy |
|---|---|---|---|
| LCDD/HCDD | Glomerular nodular mesangial sclerosis with thickening of TBM and GBM | Monotype linear pattern along TBM and GBM for LC/HC | Punctate-dense deposition of light-chain material along GBM and TBM |
| GN-associated monoclonal deposits | Membranoproliferative, membranous, or C3 GN | Monotype light chain, and/or heavy chain | Immune-type electron dense deposits |
| Amyloidosis LC/HC | Amorphous materials by H&E and weak PAS, positive Congo red | Monoclonal LC/HC | Fibrillary substructures (8–10 nm) |
| Myeloma (light-chain) cast nephropathy | Atypical, PAS-negative, fractured, and friable casts in distal tubules | Positive for light-chain immunoglobulin | Atypical and granular casts |
| Light-chain proximal tubulopathy | Light-chain proximal tubulopathy, crystalline type | Proximal tubule monotype light chain | Electron-dense crystalline structures within the epithelial cytoplasm of the tubules |
| Immunotactoid GN | Proliferative GN and thick GBM | Monotype light chain | Thick tubular substructures in the mesangium (30–50 nm) |
| Fibrillary GN | Proliferative GN and thick GBM | Most are polyclonal | Fibrillary substructures (10–30 nm) |
Related posts:


Stay updated, free articles. Join our Telegram channel

Full access? Get Clinical Tree


