Single agents are not commonly used as upfront therapy, but they are used in the relapsed setting, and understanding each drug’s activity provides insight into how much they may be contributing to combination therapy.
Thalidomide
Thalidomide is the first in the class of drugs called immune modulatory drugs (IMiDs). Recognition of the role of increased angiogenesis in the pathogenesis and progression of MM,
139 and evidence of thalidomide’s antiangiogenic properties,
284,
285 led to clinical trials in MM.
37,
286 The observed responses in patients without high-grade angiogenesis suggest that thalidomide may act via other mechanisms as well.
287 In vitro data suggest that the drug and its metabolites may inhibit angiogenesis, but in addition may modulate adhesion molecules of MM cells and their surrounding stroma, modulate cytokines, and affect natural killer cells. There is evidence that thalidomide and its analogues induce apoptosis and G1 growth arrest in MM cells.
287The first report of the utility of thalidomide in patients with relapsed MM
37 who were treated with escalating doses of thalidomide was published in 1999. Patients were started on 200 mg each evening; the dose was escalated every 2 weeks, if tolerated, to a final maximal dose of 800 mg daily. A total of 25% of patients had at least a 50% reduction in their serum paraprotein. Preliminary evidence of response was apparent within 2 months in more than three quarters of the patients who did respond. Other investigators have confirmed a partial response rate of 25% to 58%, with an additional 6% to 26% achieving a minimal response, median response duration of 9 to 12 months, 2-year progression-free survival of 10% to 20%, and 2-year OS of 48%.
286,
288,
289,
290,
291,
292,
293,
294,
295,
296 As a single agent in previously untreated patients, response rates of 25% may be achieved.
297,
298,
299 The role of dose intensity in thalidomide effectiveness is unclear.
293,
300 In the original reports, the highest dose tolerated was administered.
37 In high-risk patients there was a suggestion that response rates were higher and survival longer in patients receiving high doses of thalidomide (greater than or equal to 600 mg/day).
301 However, in some patients, responses may be seen with doses as low as 50 to 100 mg/day.
300Toxicities associated with thalidomide include fetal malformations, constipation, weakness or fatigue, somnolence, skin problems, and sensory neuropathy in more than one third of patients. There is also an increased risk of thrombosis in patients treated with thalidomide, which appears to be exacerbated by the use of concurrent combination chemotherapy, with rates as high as 28%.
302,
303,
304 Other life-threatening complications have included Stevens-Johnson syndrome and hepatitis.
305,
306Thalidomide received US Food and Drug Administration approval for use in conjunction with dexamethasone for newly diagnosed MM in 2006.
Bortezomib (VelcadeTM, PS-341)
Bortezomib is the first drug in its class of proteasome inhibitors. It is a boronic acid dipeptide that reversibly and selectively inhibits the proteasome, an intracellular complex that degrades primarily ubiquitinated proteins. The proteasome has a key role in protein degradation, cell-cycle regulation, and gene expression. Tumor cells, including MM, are heavily dependent on proteasomeregulated proteins for their growth and interaction with stromal cells. Inhibition of the proteasome has emerged as an important antitumor target, and bortezomib has been shown in vitro and in vivo to cause growth arrest, to induce apoptosis, and to inhibit angiogenesis.
Of newly diagnosed MM patients, 38% to 48% will respond to single-agent bortezomib.
316,
317,
318 The addition of dexamethasone results in an overall response rate of 67% to 88%.
317,
319 Single-agent response rates in relapsed/refractory MM range from 28% to 38% with a median duration of response of 8 months.
308,
320,
321,
322 The most common adverse events associated with bortezomib are: gastrointestinal disturbances, fatigue, peripheral neuropathy, and myelosuppression. There were 75% of patients who had serious (grade 3 to 4) adverse events, the most common of which were thrombocytopenia, neutropenia, anemia, gastrointestinal disturbances, fatigue, and peripheral neuropathy (sensory, motor, and pain).
321,
323 In a review of 256 patients treated on two phase II studies, over 80% of paitents had baseline peripheral neuropathy. Treatment-emergent neuropathy was reported in 35% of patients. Grade 1-2, 3, and 4 neuropathy occurred in 22%, 13%, and 0.4% of patients, respectively. Grade 3 neuropathy was more likely to occur in patients with a baseline neuropathy. A total of 71% of patients with neuropathy greater than or equal to grade 3 and/or requiring discontinuation who had resolution to baseline or improvement. Subcutaneous administration and/or weekly administration of bortezomib reduces the incidence of severe peripheral neuropathy by nearly 40%.
324The FDA approved bortezomib for patients with refractory MM in 2003, patients who failed one prior regimen in 2005, and as initial therapy in 2008. Because of toxicity, two important modifications to bortezomib administration have been made over the past decade. The first was introduction of weekly bortezomib rather than twice weekly followed by a 10-day rest; the second was the subcutaneous administration rather than the intravenous route of administration. This latter change was approved by the FDA in 2012 based on a randomized control trial that demonstrated comparable efficacy but significantly lower toxicity.
324 Overall response rate for both arms was 42% to 43%, but grade 3 or higher peripheral neuropathy was 6% versus 16% and any neuropathy was 38% versus 53%, favoring the subcutaneous administration.
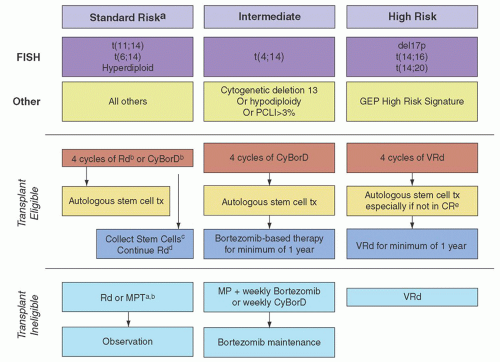
Transplant Ineligible Patients
Transplant Ineligible Patients: Phase III Trials of Induction Regimens Including IMiDs and/or Proteasome Inhibitors (
Table 98.6)
The combination of melphalan and prednisone (MP) was the standard for all patients with MM for nearly 40 years. The combination of MP has been studied extensively.
223,
230 Response rates are 40% to 60% and anticipated median survivals are 18 to 42 months.
210,
216,
223,
230,
232,
236,
257,
263,
264,
354,
371,
372,
373,
374,
375,
376,
377,
378,
379,
380,
381,
382,
383,
384,
385,
386 Because of the variable gastrointestinal tract absorption of melphalan, intravenous regimens of 15 to 25 mg/m
2 every 4 weeks along with oral prednisone or dexamethasone have been tried and resulted in response rates of 50% to 82%.
386,
387 An important phase III trial (IFM 95-01) directed at the elderly (age 65 to 75 years) was a fourarm study comparing MP to melphalan-dexamethasone (MD), dexamethasone, or dexamethasone-IFN.
249 A total of 488 patients was randomized, and follow-up was 83 months. Response rates were significantly higher among patients receiving MD, and PFS was significantly better among patients receiving melphalan (22 vs. 13 months), but there was no difference in OS among the four treatment groups. The median survival for the whole series was 35 months. The morbidity associated with dexamethasone-based regimens was significantly higher than with MP.
With the advent of ASCT, MP was relegated to those not eligible for ASCT. As drugs outside the alkylator, anthracycline, and corticosteroid classes began to show activity around 2000, combining these drugs with alkylator and prednisone became the obvious path for study.
388,
389,
390,
391,
392,
393,
394,
395,
396,
397,
398,
399,
400 Such regimens have become part of the standard for treating elderly patients with MM (
Table 98.6) in addition to a few combinations that have not been directly compared to MP, but have shown promise in either phase II or III trials.
362,
365,
366,
370 A major limitation of several of the trials that compare a doublet to a triplet is that it is often unclear what percentage of the doublet patients got access to the third drug at the time of relapse or progression.
There have been seven randomized controlled trials comparing MP to MP and a novel agent.
388,
389,
390,
391,
392,
393,
394,
395,
396 In terms of the six MPT studies, all have favored MPT with regard to higher CR rates. Four of six have been positive with regard to PFS, again in favor of three drugs over two drugs, but only three of six have been positive with regard to OS. An individual patient meta-analysis has recently been reported.
401 In aggregate, MPT was superior to MP in terms of overall response rate (59% vs 37%), median PFS (20 versus. 15 months), and median OS (39 vs. 33 months). Although this meta-analysis is an extraordinarily important study, there was no effort to examine what percentage of the relapsing MP patients received thalidomide as salvage. In a side meta-analysis examining serious adverse events of individual patient data of these same six trials,
402 a higher cumulative incidence of grade 3 to 4 nonhematologic (39% vs. 17%, HR 2.78, 95%CI 2.21 to 3.50) and hematologic (28% vs. 22%, HR 1.32, 95%CI 1.05 to 1.66) toxicities was documented with MPT. Nonhematologic toxicities were more likely to occur in patients with a baseline poorer performance status (HR 1.18, 95%CI 1.06 to 1.32). The specific serious adverse events that were more common in patients receiving MPT were peripheral neuropathy, neurologic other than peripheral neuropathy, thrombosis, and dermatologic toxicity. The experience of a nonhematologic grade 3 to 4 AE had a negative impact on both PFS (HR 1.24, 95%CI 1.07 to 1.45,
P = 0.006) and OS (HR 1.23, 95%CI 1.03 to 1.47,
P = 0.006).
The first positive MP versus MPT trial (
Table 98.6) is the the IFM 99-06 study,
388 in which 447 patients were randomized to twelve 6-week cycles of either of MP (melphalan 0.25 mg/kg per day and prednisone 2 mg/kg/day days 1 to 4 every 6 weeks) or MPT (MP plus 200 to 400 mg of thalidomide daily) or to two sequential miniautologous peripheral blood stem cell transplants (MEL100). The thalidomide was not continued past the twelfth cycle of therapy. Higher response rates and longer PFS were seen with the MPT as compared to either the MP or MEL100 groups, with respective PFS times of 28, 18, and 19.0 months. With a median follow-up of 51 months, there was a significant survival advantage for the patients on the MPT arm, with respective OS times not reached at 52 months, 33 months, and 38 months.
388The IFM01-01
391 included 129 patients over the age of 75. They were randomized to twelve 6-week cycles of either of MP (melphalan 0.2 mg/kg per day and prednisone 2 mg/kg/day days 1 to 4 every 6 weeks) or MPT (MP plus 50 to 100 mg of thalidomide daily). With a median follow-up of 47.5 months, in the MPT arm both median OS (44 vs. 29 months,
P = 0.03) and PFS (24 vs. 19 months,
P = 0.001) were longer. Grade 2 to 4 peripheral neuropathy (20% vs. 5%,
P = 0.001) and neutropenia (23% vs. 9%,
P = 0.003) were more frequent in the MPT arm.
In the GIMEMA MP versus MPT trial, patients were randomized to either standard dose oral MP for 6 months or to MP for 6 months with concurrent thalidomide, which was continued indefinitely.
389,
390 Overall response rates were significantly higher with the MPT than the MP as were the complete response rates and the median PFS rates (22 vs. 14 months,
P = 0.004). In the initial
report, there was a trend toward an improved 3-year OS in favor of MPT, but a second report with 38 months follow-up showed no difference in OS. This trial addressed a maintenance question as much as an induction question.
In the Dutch-Belgium Hemato-Oncology Cooperative Group (HOVON) 49 trial, patients were randomized to either eight cycles of MP (melphalan 0.25 mg/kg per day and prednisone 2 mg/kg/day days 1 to 5 every 4 weeks) or MPT (MP plus 200 mg/day thalidomide). The median EFS was 9 months with MP and 13 months with MPT, and 2-year PFS was 33% versus 21%,
P < 0.05. OS of those treated with MPT was also superior (40 vs. 31 months,
P < 0.05). In a partner health-related quality-of-life study,
403 the higher frequency of adverse events associated with the MPT arm did not translate into a negative effect on the health-related quality of life. Only the score for paresthesia worsened in the MPT arm, but subscales rating emotional function and future perspectives favored the MPT arm.
In the Nordic study,
392 357 patients were randomized to MP (4 days of melphalan 0.25 mg/kg per day and prednisone 100 mg/day every 6 weeks) or MPT (MP plus 200 to 400 mg/day thalidomide). Treatment was continued to plateau and the thalidomide was continued until relapse. Although there were superior CR and PR rates in the MPT arm, there was no difference in PFS or OS between the two groups. In fact, there was a higher mortality rate in the first 6 months among the MPT patients over age 75. In a partner health-related quality-of-life study, patients in the
MPT arm had higher rates of constipation and lower rates of diarrhea, physical function, and social function.
The final MP versus MPT study was conducted in Turkey where 114 patients were randomized to 12 months of MP (melphalan 9 mg/m2/day and prednisone 60 mg/m2/day for 4 days every 6 weeks) or MPT (MP plus thalidomide 100 mg/day continuously). Although response rates were higher in the MPT patients than the MP patients, PFS and OS did not differ.
CTDa (cyclophosphamide, thalidomide, and dexamethasone) is a variation on the theme of MPT. The MRC IX trial
399 randomized elderly patients to either MP or CTDa (
Table 98.4) to maximum response, with a minimum of six cycles to a maximum of nine cycles (
Table 98.6). There was a secondary randomization to thalidomide or no thalidomide maintenance.
404 Median follow-up is 44 months, and PFS was marginally better in the CTDa arm, but OS was not different between the two arms. Patients in the CTDa group had higher rates of sensory and motor neuropathy, thromboembolic events, constipation, infection, rash, and elevated alkaline phosphatase levels than did those in the MP group, but lower incidence of cytopenias.
The combination of thalidomide and dexamethasone (TD) has also been compared to MP.
405 In these 282 elderly patients although there were higher response rates using TD (68% vs. 52%,
P = 0.002), there was also higher rates AEs: neuropathy (72% vs. 33%), psychological toxicity (36% vs. 18%,
P < 0.001), constipation (33% vs. 13%,
P < 0.001), and a trend toward more DVTs (10% vs. 4%). The only toxicity more commonly seen in the MP arm was myelosuppression. With a median follow-up of 28 months, there was no difference in PFS, but there was a trend toward shorter OS among TD-treated patients which was more notable in patients older than 75 years. MP has also been compared to the combination of melphalan, prednisone, and lenalidomide in a three-arm phase III trial
398: MP versus MP with lenalidomide (MPR) versus MPR with lenalidomide maintenance (MPR-R). A total of 459 patients was randomized to either MP (nine 4-week cycles of melphalan 0.18 mg/kg/day and prednisone 2 mg/mg/kg/day days 1 to 4), MPR (nine 4-week cycles of MP plus lenalidomide 10 mg days 1 to 21), or nine cycles of MPR with indefinite lenalidomide maintenance (10 mg days 1 to 21 every 4 weeks). Overall response rates were lowest in the MP (50%) arm with progressively better rates for MPR (68%) and MPR-R (77%). With a median follow-up period of 30 months, however, neither PFS nor OS was better among patients treated with MPR as compared to MP. MPR-R patients had better PFS (31 months vs. 14 and 13 months) but not 3-year OS (70%) as compared to the other two groups (62% vs. 66%). Toxicity was substantially higher in the lenalidomide arms.
The VISTA trial
395 is the one large trial comparing MP to bortezomib and MP (VMP). Patients received nine 6-week cycles of either melphalan (at a dose of 9 mg/m
2) and prednisone (60 mg/m
2) on days 1 to 4, alone or in combination with bortezomib (1.3 mg/m
2) on days 1, 4, 8, 11, 22, 25, 29, and 32 during cycles 1 to 4 and on days 1, 8, 22, and 29 during cycles 5 to 9. All response and survival outcomes were superior with the VMP, most notably CR rates of 30% versus 4%. Median PFS was 24 months as compared to 17 months, and 3-year OS was 68% as compared to 54%.
396 Time to response was also quicker with VMP 1.4 months versus 4.2 months. Grade 3 to 4 adverse events, however, were more frequent in patients receiving VMP (46% vs. 36%). A total of 33% of patients discontinued bortezomib due to toxicity. Peripheral sensory neuropathy occurred in 44% of patients with grade 3 to 4 in 13%. Neuralgia was also reported in 36% of patients.
There are three phase III trials for the elderly that compare VMP to other regimens.
400,
406 A major finding of two of these trials was the feasibility and efficacy of changing the bortezomib scheduled from days 1, 4, 8, 11 every 21 days to a once-weekly schedule. This alteration dramatically reduced rates of peripheral neuropathy.
With median follow-up of 32 months, the VMP vs. VTP trial was negative.
400 Response rates, PFS, and OS were comparable but grade 3 to 4 AEs were significantly higher in the VTP arm. More patients in the VTP arm discontinued therapy prematurely, and they had higher rates of cardiac events (8% vs. 0%) but lower rates of infection (1% vs. 7%). An analysis based on cytogenetic risk was done, comparing outcomes based on hyperdiploidy versus nonhyperdiploidy. The 3-year OS in the VMP-treated patients was no different based on cytogenetic risk category implying that this regimen may abrogate the risk of nonhyperdiploid cytogenetics; this difference was not observed in the VTP-treated patients. There was a secondary randomization in this trial to maintenance with either bortezomib and thalidomide (VT) or bortezomib with prednisone (VP).
Palumbo and colleagues randomized patients to receive either nine 5-week cycles of VMP (
Table 98.6) or nine 5-week cycles of VMPT, which also added thalidomide 50 mg continuously, and continued with maintenance thalidomide along with alternate week bortezomib. Median follow-up at the time of the publication was 23 months. Response rates and PFS were higher in the four-drug combination with maintenance as compared to the three-drug with no maintenance, but OS was not different. Toxicity was significantly higher using the four-drug regimen: grade 3 to 4 neutropenia (38% vs. 28%;
P < 0.02), cardiologic events (10% vs. 5%;
P <
0.04), and thromboembolic events (5% vs. 2%,
P < 0.08). The most important observation of this trial was that the bortezomib schedule could be changed from days 1, 4, 8, 11, 22, 25, 29, and 32 to days 1, 8, 15, and 22 without reducing efficacy (or actual dose of drug delivered) but significantly reducing adverse events. Severe sensory peripheral neuropathy was reduced from 16% to 3%.
The multicenter, phase IIIb UPFRONT study compares the efficacy and safety in newly diagnosed MM patients ineligible for HDT-SCT of three bortezomib-based induction regimens followed by weekly bortezomib maintenance: VcD (bortezomib-dexamethasone); VTD; and VMP.
406 Although this has only been presented in abstract and oral presentation, the findings are important. Despite the highest rates of VGPR or better in the VTD arm (51% vs. 37% and 40%), with a median follow-up of 26 months, there was no difference in PFS or OS among the groups, but the mean global health status score (QOL) worsened for all groups during induction. During maintenance, QOL trended back toward baseline for the VcD and the VMP arms, but remained much lower than baseline for the VTD cohort.
Two trials address the combination of thalidomide-dexamethasone (TD) versus dexamethasone alone.
407,
408 The smaller trial is discussed in a later section and is reviewed in
Table 98.7 inasmuch as the majority of patients proceeded to ASCT.
407 The larger trial is summarized in
Table 98.6 and includes patients not destined for ASCT. In the TD arm, time to progression was significantly better (17.4 months, 95% CI: 8.1 months not reached versus 6.4 months, 95% CI: 5.6 to 7.4 months), but grade 3 to 4 adverse events were also higher: DVT/PE 15.4 versus 4.3%; cerebral ischemia 3.4% versus 1.3%; myocardial infarction 4.7% versus 1.3%, and peripheral neuropathy 3.8% versus 0.4%.
407In E4A03, the subset of patients aged 70 or older who were treated with lenalidomide with high-intensity dexamethasone (RD) or low-intensity dexamethasone (Rd) are considered.
362,
409 Although in this trial there is no comparator to MP, it is still relevant because many judge it to be an effective and well-tolerated option for elderly patients. The major findings are shown in
Table 98.6. Patients treated on the high-intensity dexamethasone arm had slightly higher response rates, comparable PFS, and inferior OS as compared the low-intensity dexamethasone arm. Rates of nonhematologic toxicity in the RD and Rd arms were 68% and 61%, respectively, with treatment-related deaths in 13% versus 4% of patients. The 2-year OS survival rate of 90% for patients treated with Rd in this randomized trial prompted a large trial
comparing Rd to MPT, which has completed accrual (MM-020), but has not yet been reported.
Transplant-Ineligible Patients: Induction Chemotherapy for Patients Ineligible for ASCT Prior to the 21st Century
The 1970s and 1980s were a testing ground for various combinations of alkylators, corticosteroids, and doxorubicin. Melphalan-cyclophosphamide-prednisone,
256 carmustine-cyclophosphamide-prednisone,
371,
372 melphalancyclophosphamide-carmustine-prednisone (MCBP),
256,
353 and vincristine-melphalan-cyclophosphamide-prednisone (VMCP)
256 resulted in response rates of 47%, 37% to 50%, 49% to 68%, and 62%, respectively. Median survivals with these regimens were 25 to 36 months.
256,
353,
371,
372 Lee and Case
260 introduced the five-drug regimen of vincristine-carmustine-melphalan-cyclophosphamideprednisone (VBMCP or the M-2 regimen), which included the same four drugs as MCBP plus vincristine; dose intensities, however, were different in these two regimens. The response rate for VBMCP was about 85% in previously untreated patients with a median survival of 38 months.
260,
410 The success of the VBMCP regimen supported the value of vincristine. However, the MRC IV trial, which randomized 530 previously untreated patients with MM to MP versus melphalan-vincristine-prednisone, revealed no difference in either response rate or OS between the two arms.
264 VMCP has not produced any response or survival advantage over MP.
383,
411Although subsequent randomized trials have substantiated the superior response rates of VBMCP over standard MP,
they have not demonstrated superior survival.
263,
376,
385,
412 In fact, the meta-analysis performed by the Myeloma Trialists’ Collaborative Group
216 involving 6,633 patients in 27 randomized trials, revealed a superior response rate (60.2% vs. 53.2%,
P < 0.000001, two-tailed) but no survival benefit for combination chemotherapy over standard MP (
Fig. 98.6). A prior meta-analysis of 18 published trials (3,814 patients) also demonstrated no benefit for combination chemotherapy in terms of survival. There was a suggestion of a survival advantage in the subgroup of patients with more aggressive disease,
355 but this was not substantiated in the larger meta-analysis.
216The use of alkylator-doxorubicin-based combination chemotherapy was stimulated by a report on the benefits of a combination of doxorubicin and BCNU in patients who had become resistant to melphalan.
413 Regimens such as MAP (melphalan-doxorubicin-prednisone), CAP (cyclophosphamidedoxorubicin-prednisone), VCAP (vincristine and CAP), and VBAP (vincristine-BCNU-doxorubicin-prednisone) were tried; by SWOG response criteria, objective response rates were 41%, 46%, 64%, and 61%, respectively.
256,
414 Median survival ranged from 30 to 32 months; subsequent analysis demonstrated a superior median survival for the VBAP arm of 37 months.
415 Enthusiasm for alternating VMCP and VBAP (or VCAP) was generated by the SWOG study of 237 patients randomized to MP or the above regimens.
380,
381 Response rates and OS were superior in the alternating combination chemotherapy arms compared to the MP arm,
414,
415 but the survival benefits of this initial study were not reproducible by others.
257,
377,
378,
382,
384,
416,
417 The V MRC myelomatosis trial randomized patients to ABCM (VBAP-VMCP without the vincristine or prednisone) or melphalan as a single agent on the basis of findings emanating from the IV MRC trial, which demonstrated a lack of benefit attributable to the addition of vincristine. Median survival in the ABCM group was superior to that of the melphalan-only arm (32 vs. 24 months,
P = 0.0003).
233,
266
Combination Chemotherapy with Interferon-α for Induction
IFN and dexamethasone have been combined as an induction regimen in patients with newly diagnosed myeloma and a low tumor mass. A retrospective comparison showed that the response rate of this regimen (57%) was similar to the response rate (48%) previously observed with dexamethasone alone.
418 A randomized trial comparing MP, melphalan-dexamethasone, dexamethasone, and dexamethasone-IFN did not demonstrate any added benefit by incorportating IFN into the treatment regimen.
249 Ahre et al.
419 randomized 55 patients to MP or IFN (3 to 6 MU daily); response rates in the MP arm were significantly higher than in the IFN arm (44% vs. 14%,
P < 0.001). These results spawned a multitude of trials adding IFN to MP
420,
421,
422,
423,
424,
425,
426,
427,
428 and numerous alkylator-corticosteroid combinations with or without anthracycline
422,
429,
430,
431,
432,
433,
434,
435,
436,
437,
438 as part of an induction regimen. Results have been mixed. Two meta-analyses have been performed in an attempt to reconcile these conflicting results.
439,
440 The first, reported in 2000,
439 used published data and included 17 induction trials
420,
421,
422,
423,
424,
425,
426,
427,
428,
430,
431,
432,
433,
434,
435,
437,
438 with 2,333 evaluable patients;
439 the second, reported by The Myeloma Trialists’ Collaborative Group in 2001,
440 used primary data from 12 induction trials
420,
421,
422,
423,
424,
425,
426,
427,
428,
430,
432,
433,
434,
436,
437,
438,
441 involving 2,469 patients.
440 Overall, the results were similar. In the first meta-analysis, the benefits attributable to the addition of IFN to the induction regimen included a 6.6% higher response rate (
P < 0.002) and a 4.8-month and 3.1-month prolongation of relapse-free (
P < 0.01) and OS (
P < 0.01).
439 In the second meta-analysis, patients receiving IFN had a slightly better response rate (57.5% vs. 53.1%,
P = 0.01) and PFS (30% vs. 25% at 3 years,
P < 0.0003), with a superior median time to progression of about 6 months. The survival advantage of 2 months, however, was not significant (
P = 0.1).
440 These meta-analyses suggest that incorporation of IFN into induction provides a modest prolongation of response and possibly of survival. Wisloff et al.
442 evaluated the quality of life of 583 patients randomized to either MP or MP plus IFN as induction. During the first year of treatment with IFN, the patients reported significantly more fever, chills, dry skin, fatigue, pain, nausea, vomiting, and appetite loss than the control patients. After the first year, however, the only symptom reported more often was dizziness. Although patients receiving IFN had a 5- to 6-month prolongation of the response and plateau phase, there was no late quality-of-life benefit observed to compensate for the early impairment. The authors questioned the clinical value of the plateau phase prolongation and reported that only 60% of patients continued to receive IFN after 24 months, suggesting that their data might underestimate the potential toxicity of the drug.