Molecular diagnostics, including DNA- and RNA-based testing and genomics, play an increasingly important role in diagnosis and monitoring of patients. The tremendous explosion of knowledge about the molecular pathogenesis of both benign and neoplastic hematologic conditions over the last 20 years has now been translated into routine laboratory assays of high complexity. Such clinical molecular diagnostic assays, including advanced DNA sequencing, microarrays, and highly sensitive polymerase chain reaction (PCR) tests, now impact diagnosis, subclassification, minimal residual disease (MRD) monitoring, outcome prediction, and therapy selection. In this chapter, we review the basis of these molecular techniques and discuss their uses in hematology currently and in the future.
AN OVERVIEW OF MOLECULAR BIOLOGY
DNA, the chromosomal material in the cell nucleus, is transcribed by polymerases to form RNA species with different functions. These include messenger RNA (mRNA) produced from each of the ˜20,000 protein coding genes, microRNAs (mIRs) transcribed from the ˜500 regulatory mIR genes, and ribosomal and transfer RNAs that are components of the ribosome and the protein biosynthesis machinery. mRNAs are then translated into proteins by the ribosome and then typically degraded quickly because of the actions of mIRs and cellular nucleases. The set of mRNAs and mIR genes that get transcribed in any particular cell is regulated by growth factor-responsive transcription factors, cell type-specific enhancer complexes, and the epigenetic state of the DNA surrounding genes as well as their scaffold histone proteins. Epigenetic modulation of DNA and histones occurs commonly through methylation and acetylation and is dynamically regulated during hematopoietic cell development and during the development of leukemias and lymphomas.1,2
Acquired (somatic) defects in one or more of these processes underlie the development of hematologic conditions (Table 4.1). In addition, inherited gene defects or normal population variations in these cellular functions lead to predisposition to subsequent development of hematologic conditions.11,12 With improved understanding of the basic mechanisms underlying disease, therapies which target the type of molecular aberrations in hematologic conditions have increasingly been developed (Table 4.2).
Extraction of Nucleic Acids: The Starting Point for Molecular Assays
Because mutations and alterations in the DNA of disease-causing genes usually lead to detectable aberrations in RNA and protein levels, a variety of analytes are available to diagnose most conditions. DNA is the most stable analyte and can be easily extracted from fresh cells, frozen cells, and formalin-fixed paraffin-embedded (FFPE) tissues. Therefore, DNA is the preferred starting material for most PCR assays and is used for DNA sequencing, for mutation detection by PCR, and for genomic microarrays. DNA is stable at room temperatures for several days, for months to years when refrigerated, and essentially indefinitely when frozen. One exception to the stable preservation of DNA is in decalcified bone marrow trephines where the acid treatment usually fragments the DNA, often making it unsuitable for PCR and microarrays.
DNA can be extracted from cells by a variety of methods, with the first step usually being disruption of the cells using a powerful protease, such as proteinase K, along with a detergent to help solubilize the cell membranes. An RNase enzyme can also be used during this step to degrade the interfering mRNA present. DNA can then be selectively isolated from this mixture using column chromatography, organic extraction of proteins followed by alcohol precipitation, or by the binding of DNA to solid substrates such as glass beads.
RNA is much more labile than DNA and can be quickly degraded in unprocessed blood and bone marrow samples and in FFPE tissues. However, RNA is still the preferred substrate to detect fusion transcripts that occur in hematologic neoplasms (e.g., BCR-ABL1) and when mRNA or mIR expression analysis is needed. Most RNAs begin to degrade within two to three days of blood or bone marrow collection even if the unprocessed sample is refrigerated; RNA must be stored frozen once extracted from cells.
RNA can be isolated from cells using methods similar to those described for DNA extraction above. Care must be taken during extraction to neutralize the RNA-degrading enzymes present in the environment and within the cells themselves. For most molecular assays, RNA is next converted into complementary DNA (cDNA) using reverse transcriptase as the first step in the protocol. Isolation of mIRs often requires modified extraction methods, but they can also be quantified using reverse transcriptase (RT)-PCR and may be more stable than mRNAs.
TABLE 4.1 DEFECTS IN THE CELLULAR MOLECULAR MACHINERY UNDERLYING HEMATOLOGIC DISORDERS
More recently, clinical assays have begun to assess the cellular epigenetic state through the detection of methylated DNA, which is typically analyzed after the methylated cytosines have been converted following deamination by bisulfite treatment. Abnormalities in protein expression are commonly assessed using immunohistochemistry on fixed tissues, or blotting or immunoassays on fresh samples. A more complete view of the genome can be obtained using conventional karyotyping of chromosomes in fresh samples, or by fluorescence in situ hybridization (FISH) and genomic DNA microarrays on fresh and fixed materials. These techniques are described in more detail in Chapter 3.
Polymerase Chain Reaction: The Indispensable Molecular Technique
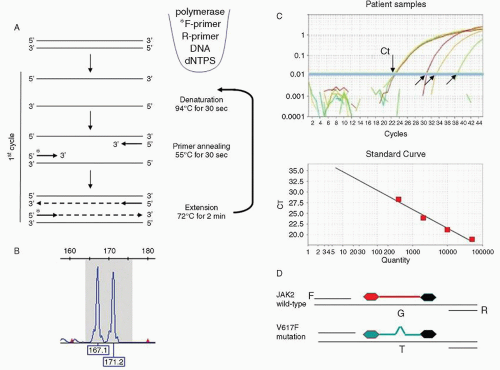
From its first application to bacterial genetics in the early 1980s, PCR has been the central technique for amplifying genes so they can be sized to look for pathogenic insertions or deletions; sequenced to look for base pair mutations; and labeled with radioactivity, fluorochromes, or chromogenic moieties to use as probes in blots and reverse microarrays. The PCR technique involves the sequential amplification by repeated cycles of DNA denaturation, reannealing, and polymerase extension of DNA targets using flanking oligonucleotides (Fig. 4.1A). In the initial cycles of the PCR, the target is exponentially amplified before gradually plateauing when the large amount of product present tends to favor reannealing of double-stranded templates rather than primer binding/extension.
To detect the products that have been amplified by PCR, the reaction is typically run out on a solid agarose or polyacrylamide substrate or gel. These PCR amplicons can be detected by a laser using capillary electrophoresis if one of the primers has been labeled with a fluorochrome (Fig. 4.1B), or by slab gel electrophoresis followed by post-staining with a DNA-binding dye (e.g., ethidium bromide) that can be visualized with ultraviolet light (see Fig. 4.2, Step 1). As described above, if RNA is to be analyzed by PCR, it is first converted into cDNA in a technique known as RT-PCR.
If fluorescent probes are added into the reaction, real-time or quantitative PCR (qPCR) can be performed to calculate the amount of an RNA or DNA target present in the initial sample. A common qPCR design is the TaqMan short, gene-specific probe that has a reporter fluorophore at its 5′ end and a quencher molecule at the 3′ end. The probe hybridizes to its target amplicon during the annealing step of each PCR cycle and is then hydrolyzed by the 5′ exonuclease activity of Taq polymerase during DNA extension. When the TaqMan probe is hydrolyzed, the reporter fluorophore is detached from the adjacent quencher molecule and fluoresces in an amount proportional to the degree of PCR product amplification. Thus, as probe is bound to template and its reporter released by the polymerase extension, the detected fluorescence rises exponentially.
In qPCR, the amount of initial target present in a PCR is backcalculated by observing the PCR cycle in which the fluorescence signal first becomes detectable. This threshold cycle (Ct) can then be used for absolute or relative quantitation. For absolute quantitation, the observed Ct is converted to a target copy number by plotting it on a standard curve (log Ct vs. starting copy number) constructed from samples with a known target copy number (Fig. 4.1C). For relative quantitation, target quantities are expressed relative to a co-amplified normalizer control (e.g., a highly expressed housekeeping gene such as ACTB [β-ACTIN] or ABL1). The quantity is then represented as a relative ratio most commonly the delta-Ct calculation: [relative quantity] = 2-(Ct of gene target – Ct of reference gene).
A specialized form of qPCR used to detect single base pair changes in DNA is allele-specific (AS)-PCR. This method compares the amplification levels of a PCR probe or primer that recognizes one allele versus the signal from a probe that recognizes only the other allele. This same protocol can also be used to sensitively detect the level of mutated sequences in neoplasms.19 This method can routinely detect the presence of a mutation down to 0.1% of the template in the sample (Fig. 4.1D).
DNA Sequencing: The Technique Driving the Genomic Revolution
The DNA sequence of genes is built up from combinations of four nucleotides, adenine (A), cytosine (C), guanine (G), and thymine (T), and their epigenetically modified variants, particularly 5-methylcytosine. DNA sequencing to determine the base composition of the genome was first routinely applied in the late 1970s but has remained a difficult and expensive technique until the last several years.
The accurate but costly gold-standard technique for determining DNA base composition, developed by Frederic Sanger, is called the dideoxy chain termination method.20 After an initial PCR step to amplify the gene of interest, this method relies on a second asymmetric PCR step in which stops in the PCR extension are randomly introduced at each position in the product by adding fluorescently labeled chain terminating variants of the A, C, G, and T nucleotides, each terminating nucleotide being labeled with a different color (green, blue, black, and red). This range of DNA molecules each terminated at a different position are then separated by size using electrophoresis and the sequence read by laser detection of the terminally labeled nucleotide (Fig. 4.2).
FIGURE 4.1. Polymerase chain reaction (PCR). A. A three-stage conventional PCR, with denaturation, annealing, and extension steps. Components of the typical PCR are illustrated including a DNA template (e.g., target gene), unlabeled nucleotides (dNTPs), a DNA polymerase to copy the templates and forward (F) and reverse (R) DNA primers, one of which is fluorescently labeled (*). B. Fluorescent products from the above PCR are then detected by capillary electrophoresis. Shown is a trace with a normally sized 167 base pair NPM1 gene product and an abnormal copy with a 4 base pair insertion (171b) characteristic of acute myeloid leukemia. C. Quantitative PCR using the TaqMan method with four samples showing differing amounts of the target gene as indicated by Cts ranging from 23 to 39 cycles (arrows). A graph showing 10-fold dilutions of a reference sample is plotted below, which are used to convert Ct in patient sample into copy number. D. Design of a TaqMan qPCR assay for detection of the JAK2 V617F mutation, with identical F and R primers but two different fluorescent probes; the red one detecting the normal JAK2 sequence (“G” at that position), and a green probe recognizing the mutated “T” sequence. The black 3′ moiety on the probes represents the quencher dye.
Newer generations of sequencing technologies that are much faster and cheaper to perform are currently replacing the Sanger method and typically use a sequencing-by-synthesis approach. As each nucleotide is added to a growing chain of DNA by the polymerase, its incorporation is detected by release of product or by its chemical or electrochemical properties.21,22
Blotting and Array Methods
An alternate method for investigating DNA sequences is solid phase hybridization, in which enzymatically-digested total genomic DNA or RNA from a cell (or specific PCR products) are size-separated using slab gel electrophoresis and then the products are transferred in place from the gel to a nylon or nitrocellulose membrane. This membrane is hybridized with a labeled DNA probe that detects the gene target. The binding of that probe is then visualized using autoradiography or colorimetric detection. In the Southern blot application, prior to electrophoresis genomic DNA is digested with one or more restriction endonucleases that cut(s) within the gene(s) of interest, so that any disruption of the gene (by insertion, deletion, or recombination) is detected by an alternately-sized banding pattern following electrophoresis and probing (Fig. 4.3).
Only gold members can continue reading. Log In or Register to continue